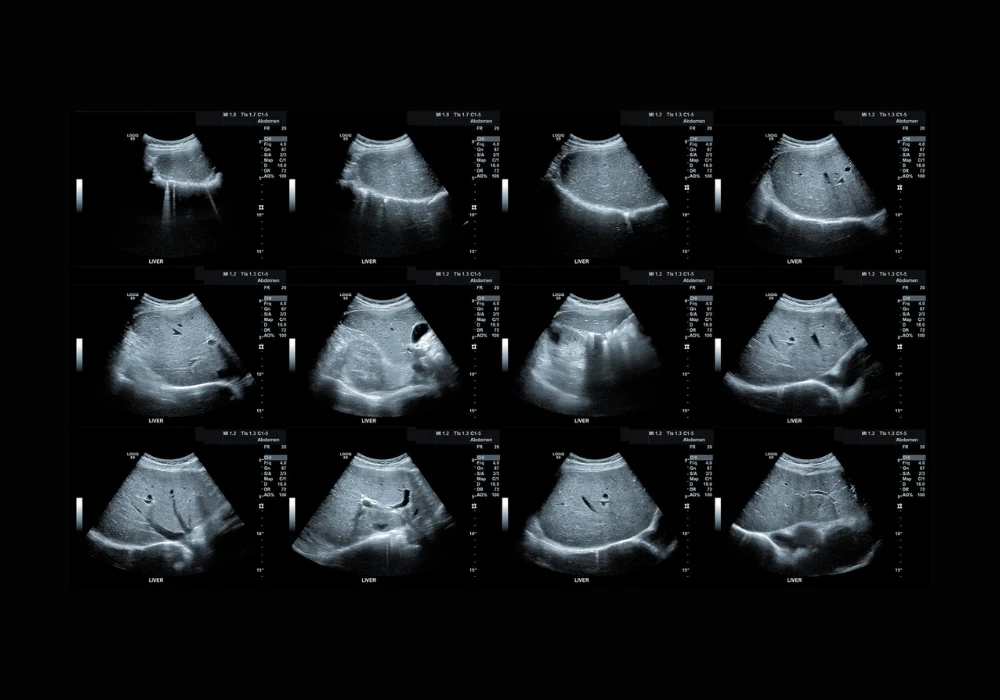
Metabolic dysfunction–associated steatotic liver disease (MASLD), previously known as nonalcoholic fatty liver disease, affects around one quarter of the global population. It is characterised by hepatic steatosis in the presence of cardiometabolic risk factors and in the absence of other liver diseases or excessive alcohol consumption. A subset of individuals with MASLD develop metabolic dysfunction–associated steatohepatitis (MASH), a condition associated with a higher risk of fibrosis, cirrhosis, hepatocellular carcinoma and increased cardiovascular and liver-related mortality. Identifying and stratifying MASLD and MASH are essential to improving long-term outcomes, but the gold standard diagnostic tool—liver biopsy—is invasive, costly and unsuitable for repeat assessment. The demand for reliable, noninvasive imaging techniques has led to the exploration of quantitative ultrasound parameters as viable alternatives.
Quantitative Ultrasound Assessment and Diagnostic Relevance
Tissue attenuation imaging (TAI), tissue scatter-distribution imaging (TSI) and two-dimensional shear-wave elastography (SWE) have emerged as promising tools for evaluating hepatic steatosis, inflammation and fibrosis. TAI quantifies the attenuation of ultrasound signals in liver tissue, while TSI evaluates the distribution of backscattered signals. SWE assesses liver stiffness by measuring shear-wave propagation. These methods were applied across a cohort of 114 adult participants recruited from four centres in China and Korea, all scheduled for liver biopsy due to suspected MASH, abnormal liver function or liver donor evaluation.
Among the participants, 67% were diagnosed with MASH and 34% were identified as having high-risk MASH, defined by fibrosis stage F2 or higher. Multivariable analysis showed that TAI and TSI were independently associated with hepatic steatosis, while SWE was associated with fibrosis. TAI and TSI values increased with advancing steatosis grade. TAI achieved area under the curve (AUC) values of 0.90, 0.93 and 0.78 for detecting steatosis grades S1 or higher, S2 or higher and S3, respectively. TSI demonstrated similar performance with AUC values of 0.94, 0.89 and 0.80 across the same thresholds. These results confirm the utility of both techniques in accurately grading hepatic fat content, especially in early and moderate stages.
Must Read: Evaluating MRI and Ultrasound for Grading Hepatic Steatosis
Evaluation of Inflammation, Ballooning and Fibrosis
In addition to steatosis, MASH is defined by hepatocyte ballooning and lobular inflammation. TSI showed good performance in detecting inflammation grade I1 or higher, with an AUC of 0.84, and moderate performance for grade I2 with an AUC of 0.63. TAI showed comparable diagnostic capacity, with AUCs of 0.79 and 0.70 for inflammation grades I1 and I2, respectively. For ballooning grade B1 or higher, both TAI and TSI demonstrated excellent performance, with AUCs of 0.90 and 0.92. However, diagnostic accuracy decreased when detecting ballooning grade B2, with TAI and TSI yielding AUCs of 0.72 and 0.63, respectively.
SWE, which quantifies liver stiffness, demonstrated strong correlation with fibrosis stage. AUC values ranged from 0.81 for detecting F1 or higher, up to 0.97 for detecting F4. Sensitivities and specificities exceeded 75% for most thresholds. These findings confirm SWE’s potential for noninvasive fibrosis staging and underscore its value in identifying patients with advanced liver disease.
Combined Parameters for MASH and High-Risk MASH Prediction
To improve diagnostic accuracy, TSI and SWE values were combined into a single model. For detecting MASH, the combined model achieved an AUC of 0.92, with a sensitivity of 80% and specificity of 95%. This was a significant improvement over serum alanine aminotransferase (ALT) alone, which showed an AUC of 0.71. The combined model also outperformed SWE alone (AUC 0.69) and showed similar or better performance compared to TAI and TSI used independently.
The model was equally effective in predicting high-risk MASH, with an AUC of 0.82. In this context, it outperformed ALT, TAI and TSI, and performed comparably to SWE. A nomogram was developed to estimate individual risk scores based on TSI and SWE values. Calibration plots demonstrated close alignment between predicted probabilities and observed outcomes, while decision curve analysis showed a net clinical benefit across a range of threshold probabilities. These tools offer practical support for clinical decision-making and individualised risk stratification.
Quantitative ultrasound parameters derived from TAI, TSI and SWE enable accurate, noninvasive assessment of steatosis, inflammation and fibrosis in MASLD. The combination of TSI and SWE provides complementary diagnostic value for detecting MASH and identifying individuals at high risk due to advanced fibrosis. These findings support the integration of multiparametric ultrasound into routine clinical practice for the assessment and monitoring of MASLD, potentially reducing reliance on invasive biopsy. Internal validation confirmed the reliability of the predictive model, though further studies with external validation are necessary to assess generalisability. Broader application across diverse populations and exploration of prognostic value will be essential to refining its clinical use.
Source: Radiology
Image Credit: iStock


