Improving radiologist performance and workflow through deep learning AI applications.
Ashwini Kshirsagar, Ph.D., Chief Scientist, Clinical Solutions, Research and Development, Hologic, Inc. Brad Keller, Ph.D., Director, Clinical and Scientific Affairs Breast Health, Hologic, Inc.
Andrew Smith, Ph.D., Vice President, Image Research Breast Health, Hologic. Inc.
Introduction
Hologic has been in the forefront of improving early detection of breast cancer as the first vendor to commercialize breast tomosynthesis technology. Tomosynthesis is becoming a standard of care in many regions, replacing conventional two-dimensional (2D) mammography, due to its simultaneous ability to increase the rate of cancer detection and reduce false recalls.1,2 Despite the overall improvement in cancer detection as a result of tomosynthesis use, there is still wide variability in performance among individual radiologists3, and cancers may be missed even with the most current imaging technology.4 In addition, the review of tomosynthesis exams requires scrolling through hundreds of images as compared to the four standard views in a 2D mammogram, increasing the potential for radiologist fatigue.
Tomosynthesis adoption presents opportunities both to further improve cancer detection and to create better efficiencies in workflow. One recent innovation that improves efficiency is 3DQuorumTM technology that uses Artificial Intelligence (AI) to create SmartSlices that reduce the number of images to review.
Another emerging technology is the application of Deep Learning (DL) to identify potential abnormalities in the tomosynthesis stack and highlight these areas for the radiologists. With advancements in the processing speed of computer technology, it has become possible to employ cutting-edge AI techniques, such as deep learning, to analyze the large amounts of image data that are generated with tomosynthesis. Hologic’s Genius AI Detection product platform will offer a series of decision support tools based on advanced AI technology.
This white paper discusses Hologic’s deep learning- based cancer detection software for tomosynthesis, Genius AI Detection, which accurately identifies Regions of Interest (ROI) containing malignancy features with greatly improved specificity compared to conventional Computer Aided Detection (CAD) algorithms.12,13 This new technology aids radiologists’ diagnostic performance and promotes reading efficiency. This paper also covers workflow enhancements that support the triaging of patients with Genius AI Detection.
Key Takeaways
Deep learning AI is the next generation of AI facilitated by advances in computational power.
Genius AI Detection is a deep learning algorithm to detect breast cancer from tomosynthesis images.
The study showed a difference of +9% in observed reader sensitivity for cancer cases using Genius AI Detection software.*12
Tools based on the AI outputs facilitate review and case prioritization.
Artificial Intelligence in Breast Cancer Imaging
Artificial Intelligence has been explored by computer scientists for several decades. AI is a broad term used to describe the phenomenon that machines or computers can mimic functions of human cognition. Machine Learning (ML) technology is a subset of AI which uses statistical models that can be trained using known data samples to perform a task at hand, such as detection of specified objects from images. Hologic has a long history of expertise in machine learning, dating back to 1998 when Hologic’s first ML- based CAD product to detect cancers from mammographic images, ImageChecker® CAD, was approved by the FDA.
Since then, Hologic has been in the forefront of developing computer assisted decision support tools
that employ ML techniques. Hologic products such as QuantraTM breast density assessment software, 3DQuorum technology, and C-ViewTM and Intelligent 2DTM synthesized images are powered by ML technology. While developing these ML-based products, which mainly utilized conventional machine learning techniques, Hologic has been working to build capabilities to employ the cutting- edge technology of DL that has recently revolutionized the field of machine learning.
Deep Learning is a subset of machine learning that utilizes the massive computational power offered by Graphical Processing Units (GPUs) to train very complex statistical models that contain hundreds of layers of parameters and are therefore referred to as “deep”. While deeper models are known to deliver better performance compared to models with fewer layers5, the amount of data required to train them is an order of magnitude higher than conventional or “shallow” models. Hologic has leveraged its large installed base of tomosynthesis systems to collect the necessary training data for development of the models to detect cancers in tomosynthesis images.
Artificial Intelligence Methods
For the purpose of understanding the most commonly employed methods of AI in breast cancer, we can separate the methods into two groups, ‘classic’ machine learning, and ‘deep’ machine learning.
Classic Machine Learning
The original CAD algorithms can be explained as ‘teaching’ the computer to detect breast cancer similarly to how one might describe the appearance of breast cancer to a human that was being trained.6 AI scientists program the software to detect and quantify image appearances or “features” that can be characteristic of breast cancer.
The design of these features requires understanding of how cancerous and normal tissue appear in images and therefore such features are called “manually-crafted” features. These are mathematical quantifications of certain properties of the images that are relevant to the detection of abnormalities. For example, areas with irregular vs. smooth margins, spiculations, or areas with bright spots with different shapes or sizes are all characteristics that can be suggestive of malignancies.
Quantified values of these features using images from patients with known diagnostic characteristics can then be used to “train” a neural network that computes a value that indicates the likelihood of cancer. The neural network can be thought of as an algebraic combination of all the features where the formula for the algebraic combination is “adjusted” based on data from known samples. The process of optimizing this algebraic combination through known examples is called “training” and is done automatically by a computer algorithm.
Figure 1 shows an example of a classic machine learning neural network. The network is trained to produce an output which gives high scores for images of known cancer and low scores for images known to not contain cancer. The training consists of taking a large set of images which contain both known cancer and known normal tissue and generating a score for probability of malignancy. Then the system will adjust the weights, shown here in yellow, green, and red to increase the accuracy. This adjustment process can be repeated many times until the algorithm’s accuracy is as high as possible. The performance of the final algorithm will depend upon 1) the selection of features used, 2) generalizability, quality, and quantity of the training data, and 3) the choice of appropriate architecture of the neural network.
This is the method that breast cancer CAD relied upon for many years.
Deep Machine Learning
Deep learning AI is known to produce performance considerably superior to classic breast cancer CAD7. Unlike classic machine learning, DL does not use “manually-crafted” features to “teach” the computer how to detect cancers by describing and characterizing imaging features. In place of the features, the inputs are the actual pixels from the image. There are many more inputs in DL, several thousand pixels, compared to a classic method whereby one describes breast cancer using tens of features. In addition to the increase of input layers, there are many more ‘hidden’ layers in the algorithm. Figure 2 shows a schematic example of a DL neural network. The training proceeds similarly to that of classic AI: one feeds many images into the algorithm and iteratively determines the weights of each node in each layer to optimize the performance of the output in identifying breast cancer. The system can be thought of as training itself what to look for.
There are some significant differences in DL methods compared to classic AI. The system requires training on a much larger number of input images in order to get optimal performance, and the number of inputs has increased from tens to several thousand. Therefore, the computational requirements are many orders of magnitude larger than classic AI, and it is only recently that computers have had sufficient power to make this method possible. The resultant DL algorithms deliver considerably superior performance compared to those using classic methods.
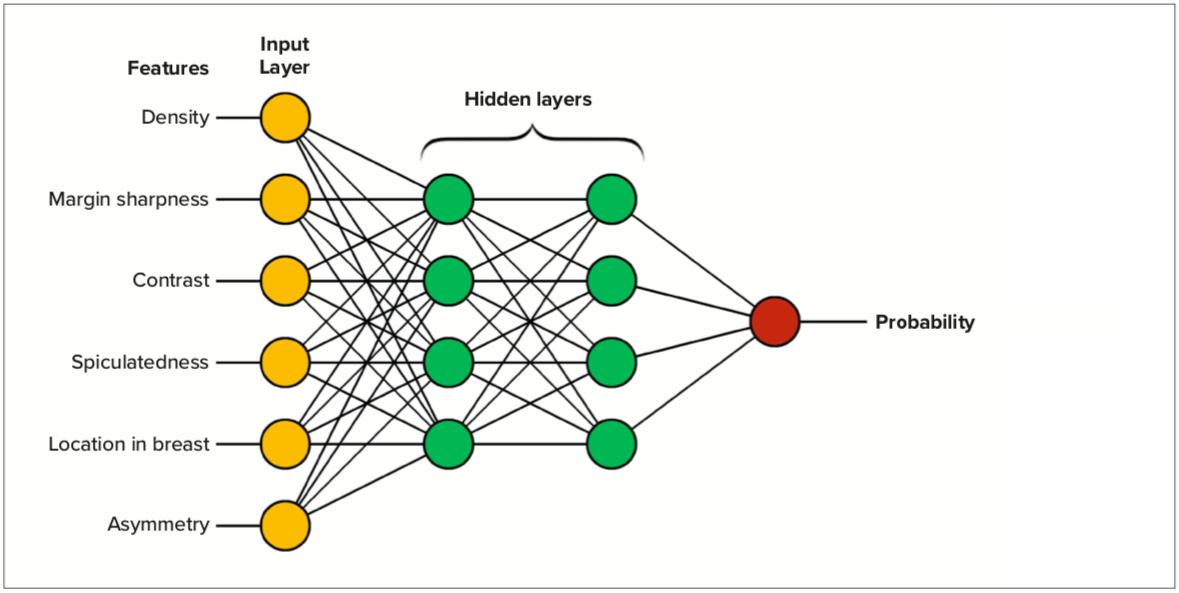
Figure 1. Example showing how a classic AI neural network is designed.
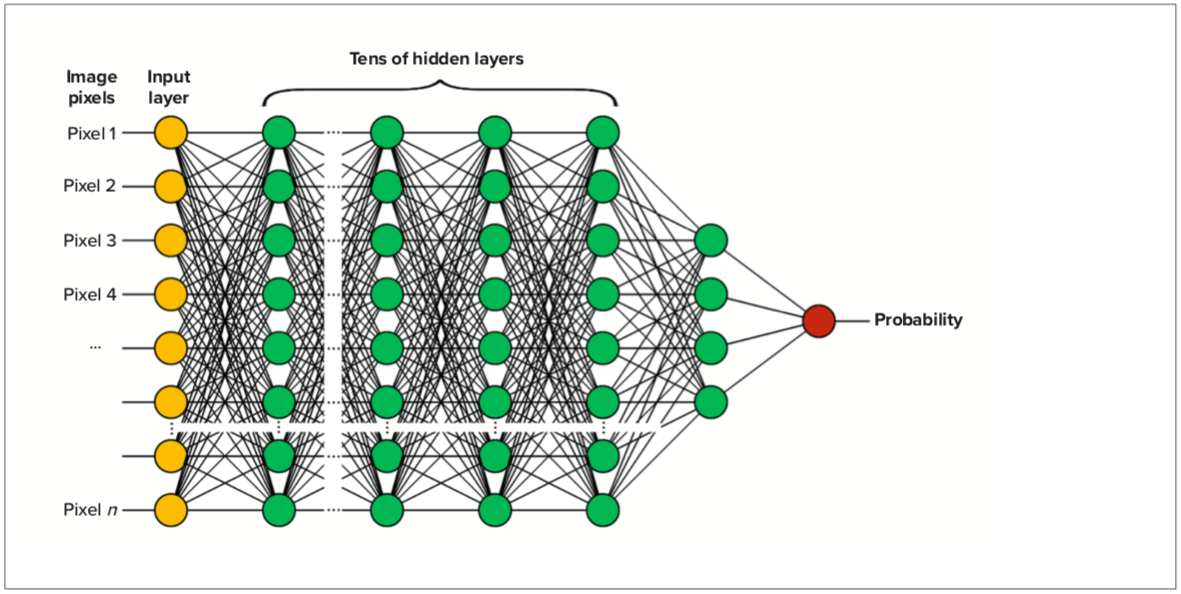
Figure 2. Example showing a deep learning neural network.
Genius AI Detection
Genius AI Detection is deep learning applied to breast tomosynthesis images obtained from Hologic’s 3DimensionsTM and Selenia® Dimensions® systems.
The algorithm is designed to locate lesions likely representing breast cancer by searching each slice of the tomosynthesis image set. These lesions are marked on the appropriate slices, using marks familiar to users of classic 2D CAD. In addition, the marks can be overlaid on a synthesized 2D image and on 3DQuorum SmartSlices.
Overlaying the marks on the synthesized 2D image helps the radiologist by providing an overview image with suspicious areas clearly indicated and quick navigation to the tomosynthesis slice that the mark was originally identified on.
Algorithm Overview
Genius AI Detection software utilizes deep learning methodology at different levels of analysis by employing state-of-the-art object detection and classification models. Several well-established deep learning-based models8,9,10 are employed in various modules of the algorithm, with proprietary training methodologies, and trained using a large quantity of clinical image data. There are separate modules dedicated for detection of regions of interest containing soft tissue lesions and those containing calcification clusters. These modules are separately trained using deep learning techniques to identify the respective types of lesions.
Figure 3 shows a schematic diagram of the high-level methodology for Genius AI Detection. Each standard tomosynthesis view undergoes a “view level” processing and then the combined results from all four standard views are processed through a “case level” processing. View level processing utilizes an object detection module to identify possible candidate ROIs that are then processed by a classification module. A classification module analyzes these regions further and assigns a confidence level to each identified candidate. Thresholds are applied on the ranked candidates to eliminate those with the lowest confidence levels from proceeding to the case level of processing.
The case level processing module analyzes candidate findings from all four views and assigns final confidence values to each candidate and an overall score to the entire case. A threshold is applied to the ranked list of candidates to be displayed to the end user as potential cancerous lesions. Each lesion is assigned a Lesion Score and each case is assigned a Case Score. Lesion Score and Case Score both range from 0 to 100 and represent the certainty that the AI algorithm identified the lesion or the case as having characteristics of cancer.
Training the Algorithm
The deep-learning algorithm was trained on a database of Hologic tomosynthesis images with the distribution of clinical evaluation as seen in Figure 4. Cases that were sent to biopsy were categorized as having lesions appearing as calcifications, masses or distortions, or both (Figure 5). The algorithm was trained to support high resolution tomosynthesis images (70 microns, 1 mm slices) and standard resolution tomosynthesis images (~100 microns, 1 mm slices).
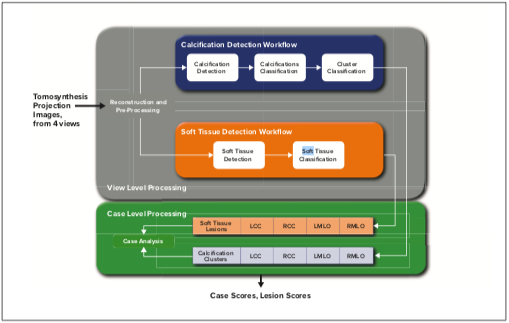
Figure 3. High-level schematic showing the Genius AI Detection algorithm.
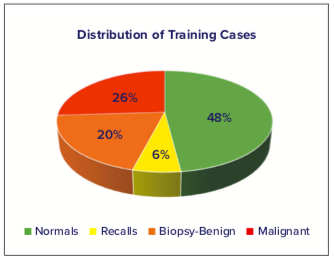
Figure 4. Distribution of training cases used to train the deep were learning algorithm. Normals were cases rated as normal at screening, recalls were cases dismissed after follow-up imaging, and biopsy cases were either benign or malignant.
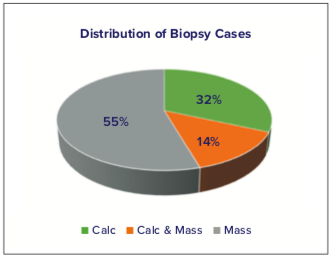
Figure 5. Distribution of morphological features for cases that sent to biopsy.
Genius AI Detection Testing
Reader Study Overview
Following the training of the algorithm from the cases described above, Hologic conducted a multi-reader, multi-case (MRMC) study to verify the performance of radiologists in interpreting 3D+2D image sets when using the Genius AI Detection algorithm in a concurrent reading mode.11 The 3D images in the study were high resolution 70-micron 1-mm thickness (Hologic Clarity HD images), and the 2D were 70-micron synthesized 2D images (Intelligent 2D images). The MRMC evaluation consisted of 17 readers reviewing 390 cases in two sessions separated by at least four weeks. In the first session each reader read a randomized mix of cases with and without Genius AI Detection information, and in the second session each reader read each case under the opposite condition.
Cases included normal mammograms, mammograms that were originally recalled by the recruiting site and dismissed after diagnostic workup, and cases that went on to biopsy, both benign and malignant; these cases were fully independent from the training data and never evaluated before this study. The distribution of these cases is seen in Figure 6. For the cases that were determined through biopsy to contain cancer, the types of cancers were characterized in appearance as mass lesions, calcification lesions, or both, with the percentages of each type shown in Figure 7.
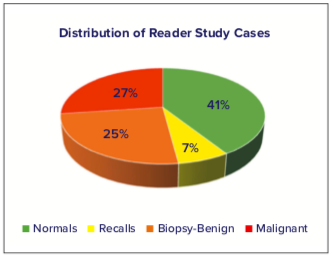
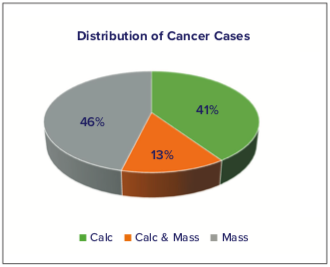
Figure 7. Types of Cancer Cases in the Reader Study Evaluation. Reader Study Results
Reader Study Results
The reader study showed a difference in +0.031 in clinical performance using Genius AI Detection, as measured using the area under the ROC curve (AUC).*12 The mean AUC averaged over all 17 readers without Genius AI Detection was 0.794, increasing to 0.825 with the use
of Genius AI Detection. Figure 8 shows the averaged reader ROC curves from the study and the standalone performance of Genius AI Detection when analyzing the same data. Remarkably, Genius AI Detection demonstrated approximately similar performance to the average radiologist’s performance in the reader study while reading without AI.
The use of Genius AI Detection technology resulted in a difference of +9% in observed reader sensitivity for cancer cases. The study showed no reduction in read time.*12
Summarizing, as demonstrated by the AUC improvement, the clinical accuracy was higher when using Genius
AI Detection.
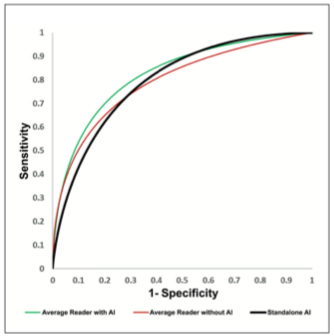
Figure 8. Pooled ROC curves demonstrating average reader performance when interpreting mammography exams with (green) and without (red) Genius AI Detection. In addition, the standalone performance of Genius AI Detection without any human reader is shown in black.
Genius AI Detection Features
Genius AI Detection generates several different outputs from the algorithm. It marks suspected lesions on the images, similarly to conventional CAD, although with improved performance as measured by a reduction in false positive markings, compared to Hologic's classic AI.12,13 Compared to Hologic's 2D CAD, Genius AI Detection has about 1/4 the false positive mark rate.12,13 The algorithm also provides an indication of complexity of the case and the likelihood that the case contains a cancer. These outputs, described below, can be used to adjust workflow according to a site’s needs and protocols.
Genius AI Detection Marks
Genius AI Detection marks are designed to indicate areas of concern. The Genius AI Detection algorithm searches for three main types of characteristics commonly associated with cancer: (a) Calc mark: indicating calcification clusters, (b) Mass mark: indicating soft tissue lesions, which include masses, densities and architectural distortions, and (c) Malc mark: indicating a soft tissue lesion associated with a calcification cluster. Figures 9, 10, and 11 show examples of calcification and soft tissue lesions marked by the Genius AI algorithm. In each example, image (a) shows the area without marks (b) shows “PeerView” marks, outlining the calcifications or the central density of a soft tissue lesion, and (c) shows “RightOn” marks, with a single mark showing the centroid of the region of interest. Note that the Lesion Score, described in the next section, is shown above the marks.
Algorithm Outputs
Lesion Score
The deep learning networks assign a relative score to each detected lesion called the Lesion Score, which represents the confidence that the identified suspicious lesion is malignant. Lesion Scores are normalized in a process that uses a data set of consecutively collected biopsy-proven malignant lesions. Lesion Scores from those lesions were ranked in ascending order. A lookup table maps each lesion score to the percent of lesions that have a lower score within the data set. The Lesion Score represents a confidence estimate and is assigned to each suspected lesion identified by the algorithm. A lesion score of 80% means that the deep learning network assigned a relative score to that lesion that was higher than 80% of representative malignant lesions, hence very suspicious for malignancy. The Lesion Score is displayed as an overlay alongside the lesion mark.

Figure 9. Example of calcification lesion. Image (a) shows no marks, image (b) shows the PeerView mark
outlining the calcifications, and image (c) shows the RightOn mark identifying the centroid of the lesion.
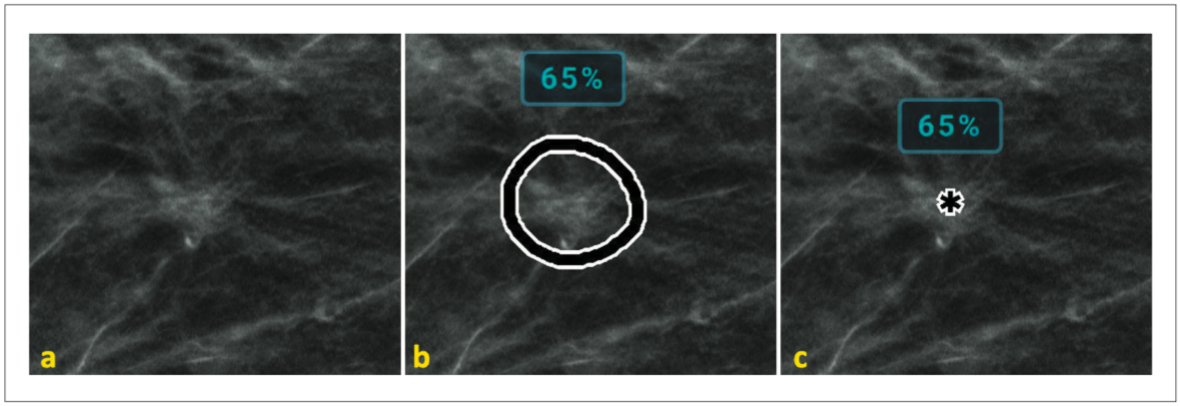
Figure 10. Example of soft tissue mass lesion. Image (a) shows no marks, image (b) shows the PeerView mark outlining the central density, and image (c) shows the RightOn mark identifying the centroid of the lesion.
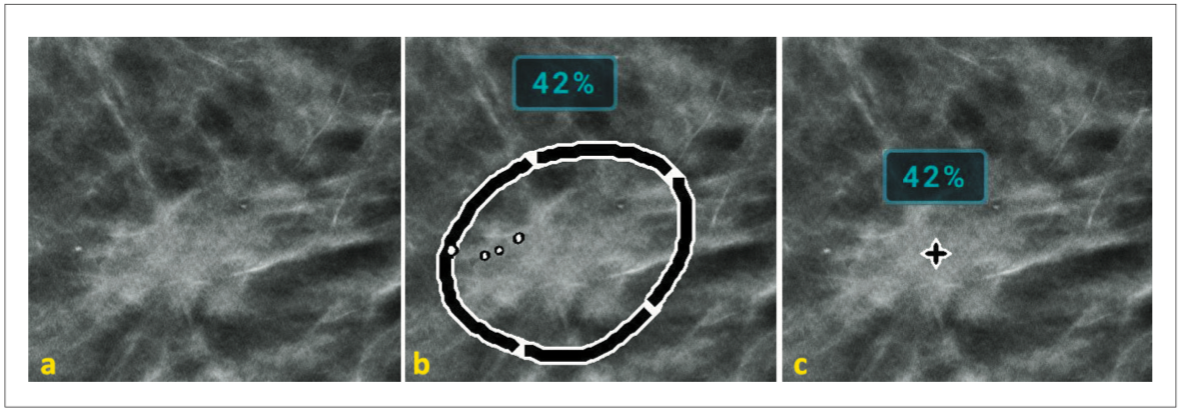
Figure 11. Example of malc lesion – containing both soft tissue and calcifications. Image (a) shows no marks, image (b) shows the PeerView mark outlining the mass and the calcifications, and image (c) shows the RightOn mark identifying the centroid of the lesion.
Case Score
The deep learning networks assign a Case Score by using information from individual lesions detected in the standard screening views. The Case Score indicates the confidence that a case has a cancerous lesion. Similar to the Lesion Score, the Case Score value is assigned by a lookup table derived from a set of consecutively collected malignant cases. An exam with a Case Score of 80% means that the exam ranks within the 80th percentile compared to other exams with a confirmed malignant lesion. The Case Score is typically displayed as an overlay during image review and can also be displayed in the patient list.
Reading Priority Indicator
The Reading Priority Indicator is derived from the Case Score and is intended to flag a percentage of cases as having a greater level of concern. The Reading Priority Indicator can be viewed on the Dimensions Acquisition
Workstation upon completion of an exam and used to identify the cases that might benefit from being reviewed by a radiologist immediately, even while the patient is still in the facility. This can facilitate any follow up imaging in the same visit and may eliminate a need for the patient to be recalled for additional imaging. The Reading Priority Indicator is configurable to allow lower or higher sensitivity according to the site’s preference.
Case Complexity Index
The Case Complexity Index categorizes cases as containing “No Findings”, “Single Finding”, or “Multiple Findings”. The number of findings identified by the algorithm can be an indicator of the complexity of the case. By counting the number of Regions of Interest flagged by Genius AI Detection, it is possible to categorize the cases by the potential difficulty to read them. The ability to sort the cases by complexity can be used to generate customized worklists for different readers.
Read Time Indicator
The underlying information about all the ROIs contains rich information that can predict if the case can be read relatively quickly or would take longer than average to read. The algorithm identifies and analyzes a much larger number of ROIs even though only the most suspicious lesions are flagged as the final output of the algorithm. This model is predictive of the reading time for a given case in three categories “High”, “Medium”, and “Low” and can be used to sort and select cases by relative reading times, for instance to distribute cases among a team of radiologists to provide a more evenly balanced workload.
Image Compatibility and DICOM
Genius AI Detection works with both standard resolution tomosynthesis and high resolution tomosynthesis (Hologic Clarity HD) images. It is also compatible with the 3DQuorum SmartSlice outputs. The output is encapsulated in a DICOM CAD Structured Report (SR) object that can be read by review workstations. The DICOM CAD SR incorporates details regarding the marks generated by the algorithm as well as various case level indices. For each mark, the coordinates of the centroid of the mark and the details of the outline as well as corresponding lesion score are incorporated for the review workstation to display as overlays. The Case Score, Reading Priority Indicator, Case Complexity Index, and Read Time Indicator are also stored in the DICOM SR so that the workstation can read these indices to facilitate worklists based on the values, as described above.
Workstation Features
Support for display of Genius AI Detection marks and associated data is dependent on the implementation on specific workstation products. Typically, workstations support tools that allow radiologists to quickly navigate to slices in the tomosynthesis image where potential lesions are marked. An example from a Hologic workstation is shown in Figure 12. In this image a synthesized 2D image is displayed on the left, and the corresponding tomosynthesis image on the right. Marks indicating potential lesions are displayed on both. When a user clicks on the mark in the synthesized 2D image, the software automatically displays the tomosynthesis slice where the potential lesion was detected in the right viewport.
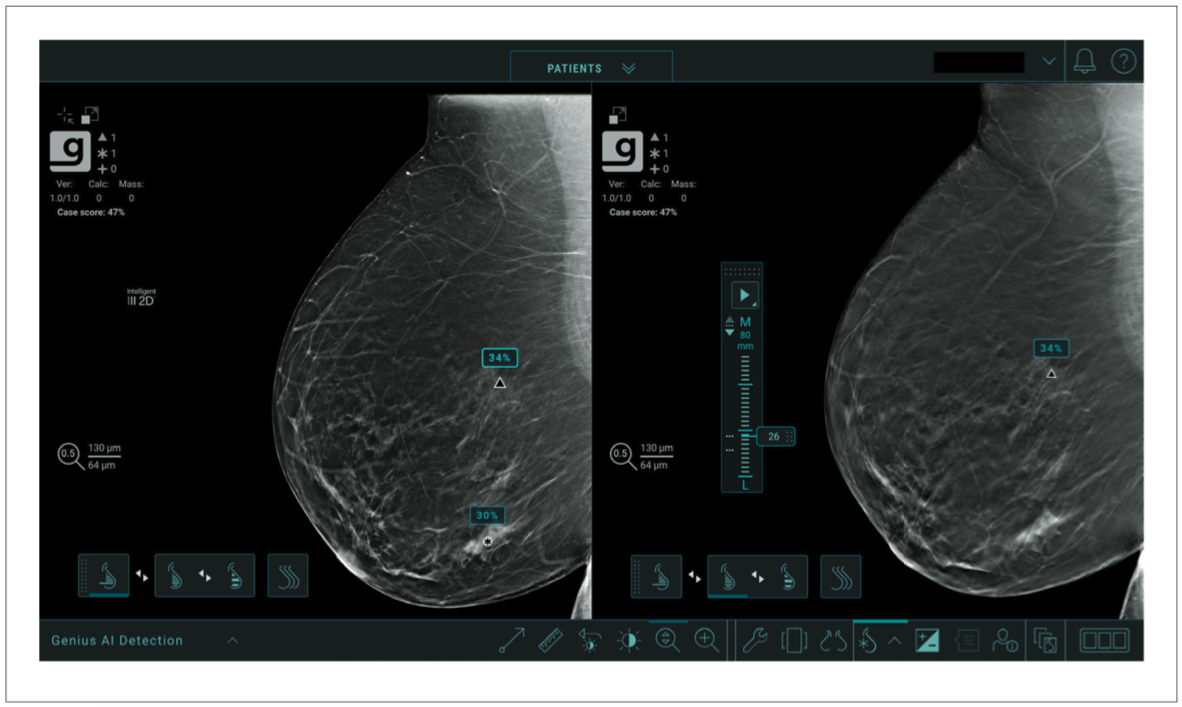
Figure 12. Display of Genius AI Detection marks and data on a Hologic workstation.
Conclusion
A software solution employing a deep learning algorithm, Genius AI Detection, was developed and trained on Hologic tomosynthesis images. It was tested in a multi-reader, multi-case study which measured its performance in the detection and characterization of breast cancer when used in a concurrent mode of operation. The radiologists demonstrated a difference in +9% in observed reader sensitivity for cancer cases.*12
The Reading Priority Indicator, Case Complexity Index, and Read Time Indicator outputs resulting from the Genius AI Detection algorithm offer opportunities for mammography centers to adjust their workflow and triage screening patients more efficiently. Cases flagged as having a high Reading Priority could be prioritized for immediate reading, even before the patient leaves the clinic. This would facilitate additional imaging if indicated, a speedier resolution of any concerns, and reduce patient anxiety resulting from callbacks. The Case Complexity and Read Time Indicators may be used to manage workflow by assigning cases to specific reading sessions or to specific radiologists.
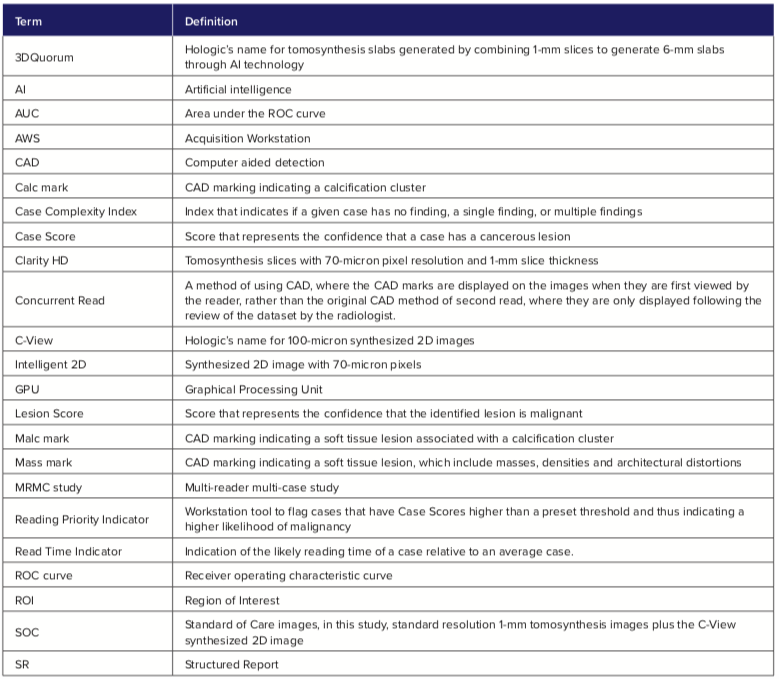
Glossary
References:
Friedewald SM, Rafferty EA, Rose SL, et al. Breast cancer screening using tomosynthesis in combination with digital mammography. JAMA, 2014 Jun 25;311(24):2499-507.
McDonald ES, Oustimov A, Weinstein SP, Synnestvedt MB, Schnall M, Conant EF. Effectiveness of digital breast tomosynthesis compared with digital mammography: outcomes analysis from 3 years of breast cancer screening. JAMA Oncol 2016;2(6):737–743.
Sprague BL, Coley RY, Kerlikowske K, et al. Assessment of Radiologist Performance in Breast Cancer Screening Using Digital Breast Tomosynthesis vs Digital Mammography. JAMA Netw Open. 2020 Mar 2;3(3):e201759. doi: 10.1001/ jamanetworkopen.2020.1759.
Conant EF, Zuckerman SP, McDonald ES, et al. Five Consecutive Years of Screening with Digital Breast Tomosynthesis: Outcomes by Screening Year and Round. Radiology. 2020 Mar 10:191751. doi: 10.1148/ radiol.2020191751.
Kaiming He, Xiangyu Zhang, Shaoqing Ren, & Jian Sun. Deep Residual Learning for Image Recognition; https:// icml.cc/2016/tutorials/icml2016_tutorial_deep_residual_ networks_kaiminghe.pdf; CVPR 2016.
Wu Y, Giger ML, Doi K, Vyborny CJ, Schmidt RA, Metz CE. Artificial neural networks in mammography: application to decision making in the diagnosis of breast cancer. Radiology. 1993 Apr;187(1):81-7.
Krizhevsky A, Sutskever I, Hinton G. ImageNet Classification with Deep Convolutional Neural Networks. Advances in neural information processing systems 25(2), January 2012.
Ren, Shaoqing, He, Kaiming, Girshick, Ross, Sun, Jian. Faster R-CNN: Towards Real Time Object Detection with Region Proposal Networks. IEEE Transactions on Pattern Analysis and Machine Intelligence 39(6), June 2015.
Ronneberger, Olaf & Fischer, Philipp & Brox, Thomas. (2015). U-Net: Convolutional Networks for Biomedical Image Segmentation. MICCAI 2015: 18th International Conference, Munich, Germany, October 5-9, 2015, Proceedings, Part III (pp.234-241) 9351. 234-241.
C. Szegedy, V. Vanhoucke, S. Ioffe, J. Shlens, and Z. Wojna. Rethinking the inception architecture for computer vision. IEEE Conference on Computer Vision and Pattern Recognition (CVPR), 2016, pp. 2818–2826.
Genius AI Detection User Guide. MAN-07021-002 Revision 001, Hologic, 2020.
FDA Clearance: K201019
DHM-10095_002 MAN-03682. Understanding R2 ImageChecker CAD 10.0. Image Checker PMA Approval P970058
*Based on analyses that do not control type I error and therefore cannot be generalized to specific comparisons outside this particular study. In this study: The average observed AUC was 0.825 (95% CI: 0.783, 0.867) with CAD and 0.794 (95% CI: 0.748, 0.840) without CAD. The difference in observed AUC was +0.031 (95% CI: 0.012, 0.051). The average observed reader sensitivity for cancer cases was 75.9% with CAD and 66.8% without CAD. The difference in observed sensitivity was +9.0% (99% CI: 6.0%, 12.1%). The average observed recall rate for non-cancer cases was 25.8% with CAD and 23.4% without CAD. The observed difference in negative recall rate was +2.4% (99% CI: 0.7%, 4.2%). The average observed case read-time was 52.0s with CAD and 46.3s without CAD. The observed difference in read-time was 5.7s (95% CI: 4.9s to 6.4s).


