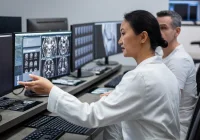
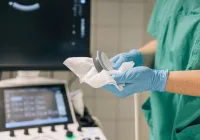
Medical imaging is among the most energy-intensive areas in healthcare, yet operational practices and procurement decisions often overlook their wider environmental footprint. A life cycle assessment (LCA) of magnetic resonance imaging (MRI) and computed tomography (CT) at a 800-bed academic medical centre in the US quantified greenhouse gas (GHG) emissions and identifies where impacts arise across production, use and supplies. By combining direct energy metering with records, observation and staff interviews, the assessment evaluated three MRI and four CT scanners over one year. The analysis captured electricity consumption, manufacturing and distribution of scanners and other capital equipment, pharmaceuticals including contrast agents, data storage, disposable supplies and linens. The results highlight dominant sources of emissions, variation between units and the potential of cleaner electricity to reshape the profile of impacts.
Measured Impact at a Single Radiology Service
Across the assessed service, annual GHG emissions were estimated at 221 tons of CO2e for MRI and 108 tons of CO2e for CT, equivalent to 52 and 25 cars driven per year. Energy consumption dominated, contributing 58% of MRI emissions and 33% of CT emissions when picture archiving and communication system (PACS) workstations were allocated by scan volume. Disposable supplies added 26% for MRI and 16% for CT, while manufacturing of scanners contributed 7% for MRI and 13% for CT when spread across a 10-year lifespan. Linens accounted for 4% of MRI and 11% of CT emissions.
Must Read: Greener Imaging: Evidence on Radiology’s Footprint
Energy demand differed between MRI models. Over one month, the 3T MRI used 1.7 to 1.9 times more energy than each 1.5T, and the two 1.5T units of similar age showed variability in energy-related emissions. For CT, utilisation and emissions also varied considerably across individual scanners. When impacts from PACS workstations and data storage were allocated by departmental activity, CT’s total increased to 139 tons of CO2e per year.
Pharmaceuticals contributed a smaller share of GHGs than energy and supplies but remained material within modality suites. In MRI, contrast agents accounted for 303 kg CO2e of the 442 kg CO2e attributed to pharmaceuticals, followed by IV fluids at 131 kg CO2e. In CT, contrast agents represented 770 kg CO2e, with fluids at 97.7 kg CO2e and smaller contributions from other drug classes. Linens also featured prominently: in MRI, flat sheets dominated by quantity, weight and emissions at 4,200 kg CO2e per year; in CT, flat sheets contributed 13,400 kg CO2e per year. Thermal blankets, gowns and towels added further impact.
Beyond GHGs, other environmental impact categories showed distinct patterns. Energy use and grid mix were again primary drivers, but manufacturing played a larger role for carcinogenic, non-carcinogenic and ecotoxicity categories due to metals processing and printed wiring board materials. Ozone-depleting emissions in MRI were mostly linked to single-use supplies through terephthalic acid production for polyethylene. Eutrophication impacts were elevated for linens, reflecting inputs from cotton agriculture and laundering.
Operational Drivers and Material Hotspots
Detailed power-mode analysis revealed that most electricity is consumed outside active scanning. During the audit month, each MRI scanner used 72–75% of total energy in low-power or ready-to-scan modes. Active scanning represented 12–18% of time and 25–28% of monthly energy consumption. The 3T system was in ready-to-scan mode 74% of the time, compared with 26–34% for the 1.5T units, and ready-to-scan used more energy per minute than low-power mode. For CT, individual scanners spent 60–91% of time in ready-to-scan and 0–36% in low-power, with non-scanning modes consuming 44–72% of each unit’s electricity. Active scanning represented 4–22% of time and 10–30% of monthly energy.
Disposable supplies formed a sizeable emissions hotspot, particularly in CT. In MRI, the most used items included patient positioners, pulse oximeters, ECG leads and slippers, with total disposable consumption of 1,690 kg and approximately 7,800 kg CO2e per year. Patient positioners and gloves were the largest contributors to MRI supply-related emissions. In CT, gloves were responsible for nearly 13,000 kg CO2e, about 60% of supply-related emissions, followed by tubing and saniwipes; the CT suite consumed 8,627 kg of disposables with about 21,600 kg CO2e over the year.
Pharmaceutical management intersects with environmental pathways beyond GHGs. Gadolinium-based and iodinated contrast agents can persist through wastewater treatment, accumulate in water bodies and contribute to downstream impacts. While GHG contributions from pharmaceuticals were lower than energy and supplies, their handling, dosing and residual management are relevant to overall environmental performance within imaging services.
Capital equipment production mattered less than energy during the baseline year but remained non-trivial. Manufacturing and distribution of scanners contributed 20.8 tons CO2e for MRI and 18 tons CO2e for CT on an annualised basis. As grids decarbonise, these embedded impacts become a larger share of the total, reinforcing procurement’s role in environmental performance.
Modelling Reductions and Practical Levers
Modelling a clean electricity scenario using solar photovoltaics (PV) reshaped the emissions profile. For MRI, total annual emissions fell by 70% from 221 tons CO2e to 66.7 tons CO2e, equivalent to removing 37 petrol cars from the road. Energy-related emissions dropped to 22.7 tons CO2e, or 34% of MRI’s total under PV. The relative shares of scanner production and supplies increased to 31% and 32% respectively, although their absolute values remained similar to baseline. For CT, PV reduced emissions by 40% to 65.8 tons CO2e per year, equivalent to 10 cars.
These shifts highlight two complementary levers. First, decarbonising electricity delivers the largest absolute reduction for both MRI and CT. Second, as energy impacts fall, manufacturing, supplies and linens account for a larger relative share, focusing attention on procurement, stocking and reuse strategies.
Operational adjustments align with the power-mode findings. Standard operation saw extended periods in ready-to-scan. Systems switch automatically to standby or low-power after 90 minutes when not in use, and further reductions depend on consistent manual placement into lower-power modes when feasible. Scheduling to consolidate activity, reducing time in intermediate modes and ensuring prompt transitions can lower consumption without affecting availability.
Supply-chain measures are clear from the emissions inventory. In MRI, targeting high-impact items such as patient positioners and gloves offers near-term benefits. In CT, gloves, tubing and wipes dominate supply-related GHGs. Reducing expired, dropped or overstocked items, and considering reusable or reprocessable alternatives such as patient positioners, blood pressure cuffs, pulse oximeters, gowns and bedpans can lower impacts when supported by appropriate cleaning protocols. For single-use device reprocessing, items such as pulse oximeters and tubing are candidates where approved.
Pharmaceutical use can be optimised through personalised contrast volumes and technologies that reduce contrast dose requirements. Separate collection and disposal pathways for residual contrast media reduce environmental release after use. Linens, which contributed 6% of MRI and 14% of CT emissions at baseline, warrant procurement of lower-impact textiles and attention to laundering pathways, as roughly two-thirds of linen-related GHGs arise post-use.
As grids become cleaner, procurement decisions gain weight. Circular approaches that extend equipment life through upgrades or refurbishment, alongside energy efficiency and service extensions, can mitigate the increasing relative share of embodied emissions from scanners and other capital equipment.
Quantified across production, use and consumables, MRI and CT services at a high-volume centre generated 221 and 108 tons CO2e per year, dominated by electricity use and reinforced by disposable supplies, equipment manufacture and linens. The largest single opportunity lies in cleaner electricity, with solar photovoltaics modelled to cut MRI emissions by 70% and CT by 40%. As energy impacts are reduced, attention shifts to procurement, reuse and stocking practices, contrast dosing and linen pathways. The findings support a dual focus on decarbonising power and systematically addressing operational and supply-chain hotspots within imaging to deliver sustained environmental gains without compromising care.
Source:Journal of the American College of Radiology
Image Credit: iStock


