Challenges and Opportunities Using the Example of a Radiology Department
Management cannot work without defining and utilising key performance indicators (KPI) to control entire business procedures. This is also a must for the health management sector. Cuts in reimbursement, higher demand from patients and referring physicians combined with a permanently varying political and legal framework require high transparency and the ability to react quickly, change strategies and optimise processes. This leads to increased requirements in the availability of information and data analysis. The implementation of modern methods in Business Intelligence (BI) opens up the opportunity to face these challenging tasks.
Why should managers in the healthcare sector care about BI? What are the costs of implementation and operation and what is the benefit? Calculating the cost of BI is definitely less complex then calculating its benefits, especially on a monetary basis (Buff 2015). The underlying problem is that BI cannot create revenues by itself, and the benefit arises from the consequences driven by its results. The use of BI is the key to identifying and implementing precise actions and observing their outcome. BI has to become a major part of the strategy of each department and the overall hospital management. Maurer et al. (2012) show that the
use of the Balanced Scorecard (BSC) is suitable for the management of a radiology department. For each perspective of the BSC objectives, measures, targets and initiatives have to be defined. The measures or KPI should be permanently observed to ensure that the predefined targets are achieved.
What is BI and What is Needed for its Implementation?
There are many definitions of the term BI published in the literature. Technically, BI summarises all applications used for the analysis of data and decision support. Thus a simple Microsoft Excel spreadsheet displaying the number of examinations and interventions at a hospital is one form of BI. This is, however, a very narrow perspective, as BI is more than that.
Business Intelligence (BI) is an umbrella term that includes the applications, infrastructure and tools, and best practices that enable access to and analysis of information to improve and optimise decisions and performance. (Gartner 2013)
This definition shows that besides the tools and applications appropriate organisational structures are necessary. For a successful implementation of a BI environment, investment in technical and personnel resources is required.
Data and its availability: First it must be clear what data is needed for the analysis. IT architecture is very heterogeneous, especially in a hospital environment. It is dominated by specific and mostly self sufficient departmental IT systems (eg, radiology, laboratory, operating rooms). Access to the data in these departmental systems can be challenging, especially if it is necessary to combine data from different systems. Depending on complexity and requirements of the analysis it is usually necessary to build a data warehouse and implement a solid ETL (Extraction, Transformation and Loading data from different systems) process. This helps consolidate and prepare the data and enables easy and reliable data analysis. The implementation of such a professional BI environment is complex and time-consuming, and often collides with the need for immediate and valid results at the management level. It also requires specific know-how that isn’t usually available in a hospital setting, especially when it comes to the analysis of data of departmental systems. Consolidation of these data requires a deep understanding of the specific application and database, ideally in combination with a deep insight into the procedures of the corresponding department. For optimal results close cooperation between IT experts and the service owner of the departmental application is mandatory.
Professional BI applications: Microsoft Excel is probably still the most common tool for data analysis and control tasks. Even in the near future it will play a significant role in detailed and ad-hoc analysis. However, for more complex and standardised data analysis the use of a professional BI application is encouraged. BI applications are suitable for the needs and requirements of quick, reliable and intuitive KPI. They outperform the common means of reporting and analysis with high performance and flexibility, especially in handling big data, complex algorithms and visualisation of KPI. Additionally, as the extraction and preparation of data can be run automatically, independent data access can be granted to all staff.
Currently, many different and powerful applications exist, and finding the right application is not easy. As always, individual solutions and vendors have their own strengths and restrictions, making it helpful to start with an overview of the BI solutions market. The following professional market overviews may help to sift the eligible applications.
- Magic Quadrant for Business Intelligence and Analytics Platform - gartner (gartner.com)
- Healthcare Analytics Performance - KLAS (KLASresearch.com)
- BI Survey -BARC (barc-research. com)
The second step in choosing the right solution is based on individual requirements. It is strongly recommended to create a detailed requirements specification, which should be drawn up in collaboration with users (such as controllers and managers), the departmental applications administrators and IT experts. The resulting document will assure that defined specifications are fulfilled. The document should contain the following topics.
- Goal (Why should a BI application be implemented?)
- Visualisation and analysis (eg dashboards, charts, interactive visualisation, drill-down)
- Additional functionalities (eg use of mobile devices, export of data)
- Data integration (eg compatibility, transformation)
- Installation (eg servers, compatibility)
- Administration (eg performance, support, community)
Personnel resources, know-how and skills: For successful BI solution implementation personnel resources with specific know-how and skills must be considered. Permanent training is a must to suit continuous development in this dynamic field. For instance, in a radiology department the administrator of the Radiology Information System (RIS) will be the one with knowledge and access to the database and a good insight into departmental procedures. He/she might not, however, have the skills for implementing and operating a professional BI solution, and might lack data access to other applications if needed for further analysis. This is when other experts come into play. For personnel with usual IT skills the use of modern BI applications is easy to learn. Initial results are available within the first two weeks, but for routine use of the extensive features a training period of at least one year must be taken into consideration. Modern teaching methods, such as video tutorials, online courses and user communities, are helpful and, compared to conventional teaching methods, less expensive.
The ongoing effort to prepare and publish reports and analysis will decrease with successful implementation of a BI approach. However, a substantial investment in the initial implementation of the new system is required. But this investment will result in a greater benefit. At the start management is responsible for evaluating if the required personnel resources and skills are available. In bigger hospitals a central unit for control and BI might be in charge of delivering reports and KPI to the CEO on the level of a management information system. Nevertheless a decentralised control structure is necessary, as staff from a central control unit are too far removed from the business of specific departments. Definition and deployment of KPI in these departments always demands knowledge of its processes and rules. For radiology Busch (2013) describes the need to establish a position alongside the chairman to offer support in areas like organisational development, process optimisation and control in a modern radiology department.
What Happens if Technical Implementation is Done?
How many CT scans did we have in neuroradiology in the first five months of the current year compared to the same time period last year? And how do they divide among the different referring physicians?
Questions like these will be asked frequently by responsible managers. With a professional BI solution these types of questions can be answered in seconds. Above all, these questions can also be independently answered by the user. The user interfaces of these applications are very intuitive, and the database beneath the charts is well prepared to guarantee valid KPI. This relieves the analyst of the time-consuming, endless preparation of new insights on data and the building of new reports and charts. Finally, the analyst can spend more time on the interpretation of data than on preparing it.
Now, two important prerequisites for a successful implementation (Busch 2011) — quick availability and low running effort — are fulfilled. The next step defines the required KPI. These should be oriented to the strategic objectives of the hospital or department, and should include strategies and consequences in case targets are missed. A description of each KPI’s interpretation and metric is necessary to avoid misinterpretation by different recipients. Ideally, these descriptions are included directly in the BI application, to synchronise access to KPI, their definition and explanation at the same time.
Initially, the definition of KPI seems straightforward, but the daily use of KPI shows that it is quite difficult, and misinterpretations occur frequently. This can be illustrated using the most common KPI in radiology — the number of examinations. How to count a combined CT scan of the thorax and abdomen? It can be counted as a single examination, corresponding to the number of time slots that one has to plan in the scheduler. But it also can be counted as two examinations, corresponding to the different body regions read by the radiologist which can be reimbursed. Neither interpretation is right or wrong. The key is to determine which of these interpretations is valid, to guarantee that all recipients are working with the same format. For this reason, it is recommended to verify the algorithm on which the KPI is based and its interpretation in the sense of quality assurance. Verification and quality assurance is not the responsibility of the analyst. Rather it is that of the ‘customer’ (management) to the ‘supplier’ (analyst), and should be confirmed with an acceptance document.
Implementation Phases
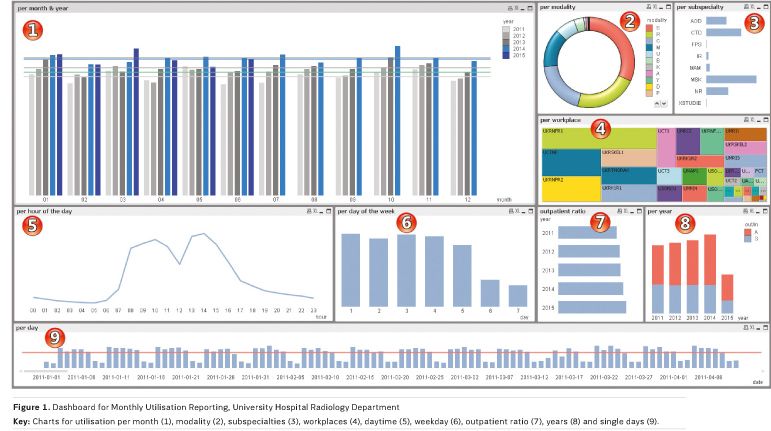
Initially BI will take over the tasks of common retrospective reporting such as the monthly utilisation report. But even for this simple task a modern BI solution offers significantly more possibilities. Performance, availability, flexibility and the depth of possible views on the reports exceed the capacity of conventional manual provision of reports. Figure 1 shows an example of a BI dashboard used in a radiology department to show utilisation figures. Success and acceptance of BI depends massively on the early availability of initial results (Bachmann and Kemper 2011). These ‘quick wins’ are the basis for further development and support by the board and the recipients. The easiest way to achieve this is by transforming retrospective reporting into a BI system, because well-known content and visualisation can be enriched with new functionalities and more flexibility.
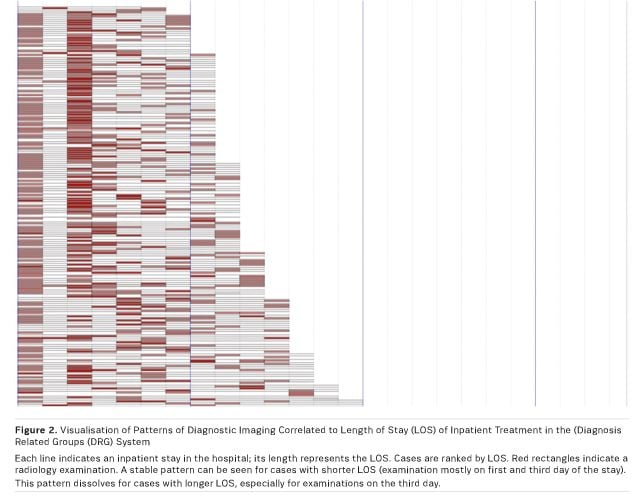
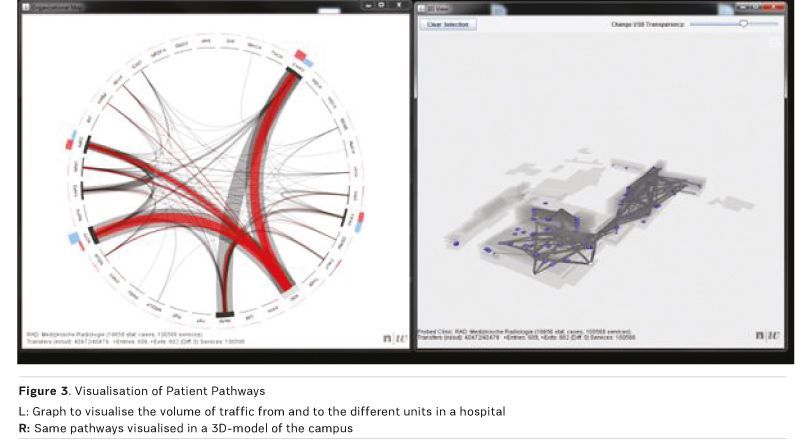
Soon after this kind of reporting is available users will start to dig deeper into data analysis. This is when requirements of data complexity start to increase, as data from other applications come into play. Figure 2 shows an example in which data from the RIS is matched with data from the Diagnosis Related groups (DRg) system. The visualisation in this case helps to identify correlations between patterns in radiology procedures and the length of stay of inpatient treatment (Truong 2015). Figure 3 shows another example of the analysis of patient’s pathways within a hospital and its visualisation, using a 3D model of the campus (Brodbeck et al. 2013). Possibilities seem to be infinite, but on the other hand this demands high discipline from the recipients of data analysis and visualisation. Every complex analysis is accompanied by additional effort, and not every fancy visualisation is rational. There should be no analysis without a specific goal and a corresponding consequence.
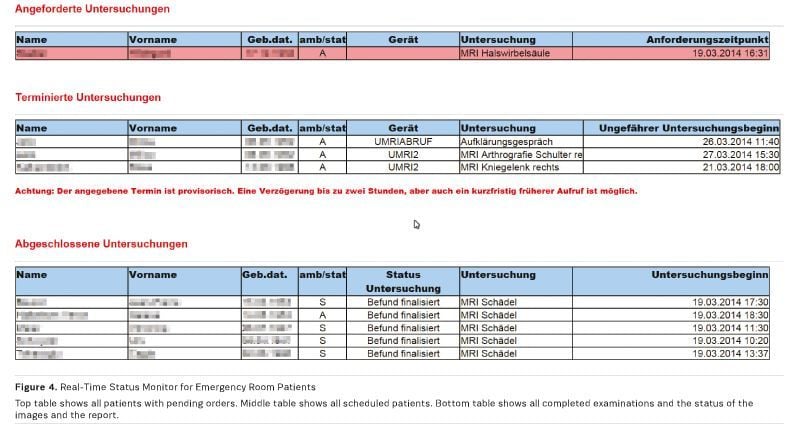
Another important use for BI is realtime monitoring (RTM). In this context RTM is defined as a continuous extraction of data in real time (or near real time) for the purpose of controlling processes. In health management this approach is underrepresented, as it has been established in productive industries (eg, automotive or chemistry) for decades. No chemical reaction would run properly without control of temperature, pressure, etc. Naturally, procedures in healthcare are not as deterministic as in the production of automotive parts, yet the control process can be a very helpful approach for all stakeholders (Escher et al. 2015). A remarkable example is the provision of the status of patients sent from the emergency room to the radiology department for further diagnosis. This is deployed by monitoring status based on RIS data, which shows the status of all patient orders from the emergency room (see Figure 4). Knowledge of the whereabouts of the patient, the availability of images and reports will help the emergency physician monitor progress of the requested examination. Time-consuming frequent inquiries by telephone decrease to a minimum. This is a benefit for the emergency room, the radiology department and even the patient.
BI: A worthwhile investment!
There are many possible uses for BI. For example, it can answer many questions about business administration. The effort to implement and operate BI should not be underestimated, but it can ultimately reduce the running effort for the conventional labour-intensive provision of data. Managers will see the value combined with rapid availability and flexible analysis and visualisation possibilities. This is why BI will be an indispensable tool in central and decentralised hospital management.
Key Points- Business Intelligence (BI) is a worthwhile investment, and will play a significant role in hospital management in the near future.
- Implementation of BI is challenging, requires resources, skills and a strategy, but enables management to have easy access to relevant analysis of data and visualisation of important key performance indicators (KPI).
- Modern BI applications will help to overcome shortages of common ‘hand-made’ analysis, save time and money, and will enable even managers to do ‘self-service’ analysis and reporting.
Bachmann R, Kemper G (2011) Parallelisierung von
BI-Infrastrukturaufbau und Quick Wins. In: Raus aus der BI-Falle: wie Business
Intelligence zum Erfolg wird. 2nd ed. Heidelberg: mitp, pp. 228-33.
Brodbeck D, Degen M, Walter A (2013) Supporting strategic
planning with interactive visualization: a case study of patient flow through a
large hospital. HEALTHINF 2013, 6th International Conference on Health
Informatics, 11-14 February, Barcelona, Spain [Accessed: 1 October 2015]
Available from blogs.fhnw.ch/biomedinf/
files/2014/10/mplan-healthinf2013-cr.pdf
Buff A (2015) Where’s the money in data? Information Management,
15 September. [Accessed 01 October 2015] Available from
information-management.com/news/big-data-analytics/wheres-the-money-in-data-10027496-1.html
Busch HP (2011) Kennzahlen und Informationen zur Steuerung
und Optimierung radiologischer Abteilungen (Imaging-Center). Radiologie
up2date, 11(3): 267-84.
Busch HP (2013) Imaging Center – Optimierung der
diagnostischen Bildgebung im DRG-Zeitalter. Fortschr Röntgenstr 185(4): 313-9.
Escher A, Bongartz G, Merkle E (2015) Realtime monitoring in
radiology: the key to optimising report turnaround times. HealthManagement.org
The Journal, 15(1): 62-4. [Accessed: 1 October 2015] Available from https://iii.hm/yb
Gartner Inc. (2013) Business Intelligence (BI) [Accessed: 1
October 2015] Available from gartner.com/it-glossary/business-intelligence-bi/
Maurer MH, Teichgräber U, Kröncke TJ et al. (2012)
Balanced-Scorecard – Anwendungsmöglichkeiten in der Radiologie. Fortschr
Röntgenstr 184: 1118–1125.
Maurer M (2012) Application of the balanced scorecard in
radiology. Imaging Management, 12(4): 33-5.
Truong J (2015) Explorative data analysis for process
optimization in the radiology department of the University Hospital Basel.
Unpublished thesis, Master of Sciences in Life Sciences FHNW, Institute for
Medical and Analytical Technologies, Switzerlan