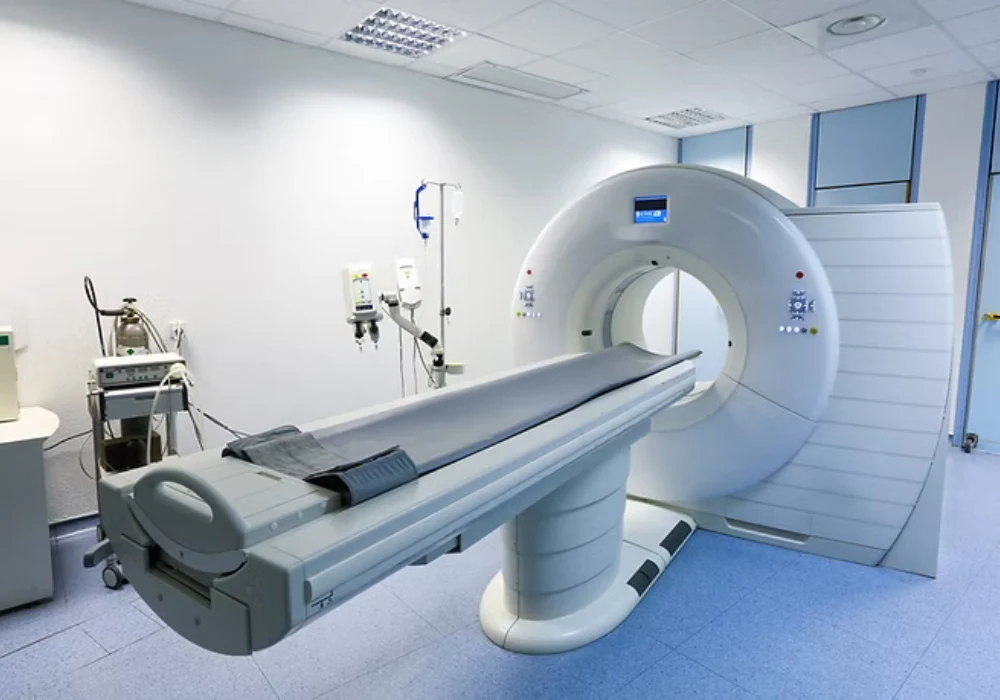
Computed tomography (CT) became central to diagnosing and monitoring COVID-19, reshaping chest imaging workflows across hospitals. Analysis of routine operational data from ten public hospitals spanning January 2019 to December 2024 shows how volumes and dose metrics evolved from the pre-pandemic period through the pandemic and into the post-pandemic phase. From 241,217 CT examinations, 62,981 involved the chest, equating to 26.1% of activity. Chest CT volumes rose sharply during the pandemic, then reached a plateau and remained stable afterwards, while total CT use across all body regions continued to increase. Over the same period, average patient exposure indicators for chest imaging declined with technology renewal and protocol optimisation, supporting effective dose management without reversing the gains in access and throughput.
Multicentre Volume Trends Across Three Periods
Monthly activity rose across all CT examinations from 2019 to 2024, with a 58.8% increase in examinations per device when comparing 2024 with 2019. Chest CT followed a distinct pattern: volumes surged during COVID-19 then stabilised at a higher level than before the pandemic. Normalised by device count, average chest examinations increased from 636.0 in 2019 to 988.1 in 2020, a 50% rise that was statistically significant with p < 0.001. Activity remained high through 2021 and 2022, then eased slightly in 2023 to 935.9 chest examinations per device, a non-significant reduction (p = 0.14). By 2024, chest examinations per device reached 1,058.4. As a proportion of all CT, chest imaging moved from 24.3% in 2019 to 26.6% in 2020, then varied between 24.2% and 29.1% in subsequent years, ending at 25.4% in 2024.
Period-level summaries align with this trajectory. Median monthly totals for all CT examinations progressed from 2,137.5 before the pandemic to 3,312.0 during the pandemic and 4,362.0 post-pandemic. Chest CT medians moved from 508.5 to 897.0 and then 1,080.0 across the same intervals. Aggregated counts per period further illustrate the scale: 6,999 chest CTs before the pandemic, 35,530 during the pandemic and 20,452 post-pandemic within the defined windows. Throughout, patient demographics remained consistent, with mean age around 62 years and mean weight around 76 kg across periods.
Must Read: Best Practices for Post-COVID-19 Chest CT
These usage patterns were underpinned by a stable and expanding device base, rising from nine CT scanners in 2019 to thirteen in 2024, with some replacements over time. Operational data were drawn directly from a commercial dose management system and its analytics platform, ensuring standardised capture of exam counts and associated metrics across participating hospitals. Institutional review board approval was waived, and all patient data were anonymised.
Dose Metrics and Exposure Management
Despite higher volumes, average exposure levels for chest CT did not increase. Instead, chest dose indicators declined while remaining level across all CT examinations. For chest CT, the mean volume CT dose index (CTDIvol) fell from 9.69 mGy in 2019 to 7.44 mGy in 2024. Dose length product (DLP) for chest CT moved from 351.0 mGy·cm in 2019 to 323.8 mGy·cm in 2024. Over the same period, all-CT CTDIvol remained broadly stable around 16 mGy, and all-CT DLP values remained in the mid-400 mGy·cm range.
The reduction in chest CT dose coincided with ongoing protocol optimisation and the introduction of newer hardware and software as older devices were replaced. The analysis of dose focused on demonstrating overall trends rather than attributing precise causal contributions from technology, protocols or patient factors, and it did not evaluate cumulative risk from repeated examinations. Even so, the observed downward trend in chest CTDIvol and the consistency of DLP across years indicate effective dose management practices during increased clinical demand.
Statistical testing supported these observations. Differences in exam numbers were assessed with chi-square tests and differences in average exposure with independent t-tests, with significance set at p < 0.05. Across the evaluated period, average patient exposure remained level for all CT and declined for chest CT, reinforcing that throughput gains did not come at the expense of exposure control.
Protocol Shifts and Scan Length Patterns
Protocol utilisation shifted with clinical needs before, during and after the pandemic, and scan length patterns reflected these changes. Before the pandemic, thorax–abdomen protocols represented 26% of chest examinations, pulmonary embolism protocols 5% and thorax native protocols 35%. During the pandemic, thorax–abdomen increased to 29% and pulmonary embolism to 10%, while thorax native decreased to 26%. In the post-pandemic period, thorax native rose to 33%, thorax–abdomen accounted for 28% and pulmonary embolism protocols decreased to 4%.
Scan lengths mirrored protocol selection. Average scan length for chest CT native was 36.3 cm, for pulmonary embolism 33.7 cm and for thorax–abdomen 48.7 cm. Across the pandemic and post-pandemic phases, chest scan lengths increased and then reached a plateau, consistent with the broader fields of view and indications inherent to protocol mix. In contrast, scan length for all CT examinations remained stable over time, underscoring that the chest-specific evolution was linked to clinical pathways rather than a system-wide shift in acquisition extent.
These protocol transitions also align with dose trends. As thorax–abdomen carries a longer scan length than native or pulmonary embolism protocols, careful optimisation was needed to balance diagnostic requirements with exposure. The observed decline in chest CTDIvol alongside evolving scan lengths suggests that dose-saving advances and protocol refinements offset potential increases arising from broader coverage.
Sustained demand for chest CT persisted after the acute pandemic phase, with volumes stabilising at levels above those seen before COVID-19 while overall CT activity continued to rise. Over the same period, average exposure indicators for chest imaging declined and remained controlled across all CT, reflecting effective dose management supported by technology evolution and protocol optimisation. Protocol utilisation shifted with clinical needs, and scan length patterns followed, yet exposure metrics remained favourable. These findings support ongoing investment in imaging capacity, analytics and protocol governance to maintain access, efficiency and radiation safety as services adapt to long-term post-pandemic requirements.
Source: European Radiology
Image Credit: iStock


