Introduction
Background
Dedicated ultrasonic breast scanners were first reported in the 1960s [1, 2]. Over the last 5 decades the development of automated whole breast ultrasound (US) scanners has accelerated by advances in higher US image resolution and increased computational processing power to handle three-dimensional (3D) image-sets in real-time [1–3]. The use of automation to acquire ultrasound images to detect breast cancer is similar to the renaissance of tomography in digital breast tomosynthesis (DBT) in that they both combine a long-established imaging technique, ultrasound or tomography, with a newer ability to digitally store and process 3D imaging sets. The use of volumetric images of the breast allows for representation of the entire breast volume as a scrollable stack of images on a workstation monitor. The achieved higher 3D resolution of the breast tissue can result in higher displayed spatial 3D resolution. In comparison, handheld (HH) US and full field digital mammography (FFDM) store images in rather static two dimensional (2D) projections. When HH US is used, radial and antiradial or transverse and longitudinal planes are frequently used as orthogonal projections to record significant imaging findings in the picture archiving and communication system (PACS). To capture the images in FFDM technique, the mediolateral oblique (MLO) and craniocaudal (CC) views are the most commonly used projections for interpretation. For both mammographic modalities, FFDM and DBT, the use of X-rays is required to radiograph the breast tissue. Unlike with X-ray imaging, no ionizing radiation is necessary to create the images with US high frequency sound waves and with magnetic resonance imaging (MRI). Meanwhile MRI is still in need of contrast medium (CM). In this regard automated ultrasound (AUS) is in today’s standard the only modality able to depict the whole breast in a tomographic representation without the use of ionizing radiation or need of contrast medium (Table 1). The clinical benefit of using higher 3D spatial resolution in AUS and DBT is that it may enable better differentiation of benign and malignant findings compared to a static 2D image interpretation. The transition to a volumetric breast examination reading may minimize the masking effect of overlying tissue in DM and the operator dependence in US [4–6]. A more widespread use of volumetric breast ultrasound modality systems however requires evaluation of the advantages and challenges when introduced into the clinical setting to unfold its full potential. To support the transition from using 2D oriented modalities to a successful clinical integration of 3D modalities, this publication presents material that is based on decade long experience in AUS technology and in production of educational programs benefitting physicians in AUS interpretation. The aim of this article is help transition 3D AUS to a broader audience and to increase specificity and positive predictive values by decreasing false positive interpretation results.

Table 1: Breast imaging modalities in clinical use today categorized by the ability to depict the whole breast, to be tomographic in image representation, and the need to use ionizing radiation (IR) or intravenous (IV) contrast medium (CM). Over the last two decades digital breast tomosynthesis (DBT) and automated breast ultrasound (AUS) have become more widespread in clinical use. In addition to Breast MRI, DBT and AUS enable depiction of the whole breast in a tomographic representation. Whereas DBT involves the use of ionizing radiation to produce the images, MRI is currently still in need of IV contrast medium application to provide diagnostic kinetic curve type assessment for classification of breast lesions. AUS however has an advantage since it is tomographic and depicts the whole breast without the need of ionizing radiation or IV contrast medium.
AUS image acquisition and positioning
To acquire the images a wide field of view ultrasound probe with a width of 15.4 cm travels from inferior to superior over the breast tissue to capture the images in a transverse direction. The ultrasound probe is covered by a housing. At the bottom of the housing a one-time use mesh is attached to protect the scanner. The images presented in this article are obtained with an AUS system that scans the patient in a supine position (ACUSON S2000 Automated Breast Volume Scanner; Siemens Healthineers, Mountain View, CA, USA). To yield a better quality of scanned images and to lower the frequency of artifacts while scanning, a coupling lotion is used and is spread evenly over the breast before the scanner is positioned on the patient’s breast. While the image-slices are scanned one after another, the images are digitized and stored on the AUS machine. One complete scan cycle is finished in about 60 seconds and forms the original set of images that includes a maximum of 320 images per scan. The original set of images is acquired in the transverse direction and builds the basis for later software processing to reconstruct two additional orthogonal planes per scan, the coronal plane (Z) and the sagittal plane (Y) (Fig. 1).

1 Image acquisition. The wide field of view ultrasound probe is positioned in anterior-posterior position on the patient’s breast. While traveling from the inferior to the superior region of the breast the images are consecutively recorded in the transverse plane (X) (green arrows). An oval parallel circumscribed hypoechoic mass can be seen on the transverse plane in this case of a 29-year-old woman with a history of biopsy- proven fibroadenomas. The same mass is also seen in the inferior region after reconstruction on the coronal plane (Z) as well as the sagittal plane (Z) next to similar appearing lesions in this multiple mass case
Usually three scans per breast are obtained to cover all of the breast tissue in the anterior-posterior (AP), lateral (LAT), and medial (MED) position of the transducer. The image-sets resulting from the AP, LAT, and MED positioned scan are identified as views in this article and differentiated from the three orthogonal planes per scan, the transverse, coronal, and sagittal planes.
Reconstruction of additional planes
After acquisition of usually six scans per examination, three per breast, the images are sent to the PACS. When the studies are received by the PACS, the reading software on the physician’s workstation allows for interpretation of the AUS examinations. To display the volumetric image-set for interpretation, the acquired transverse plane is reconstructed in two additional orthogonal planes, the coronal and sagittal planes. The coronal plane (Z) as a reconstructed plane depicts the entire breast of a supine positioned patient. On the coronal plane the breast tissue is presented with the patient similarly positioned as for a potential interventional ultrasound guided procedure or breast surgery (Fig. 2). The reconstruction, with the help of the coronal plane, allows for improved depiction of imaging findings such as architectural distortion as well as multiple benign-appearing masses as seen in Figure 2. The darker appearing tissue is fatty and the lighter appearing tissue is fibroglandular. Usually a yellow circle or square denotes the nipple location.
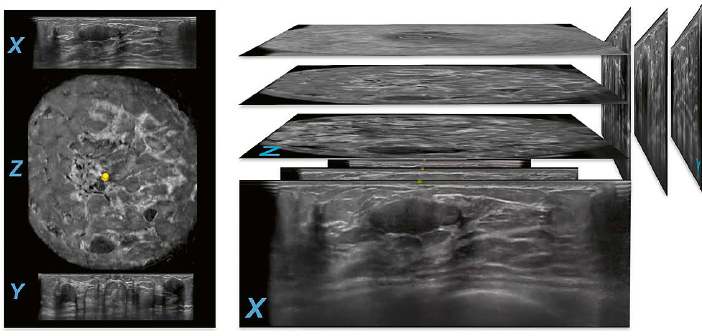
2 Reconstruction of AUS planes. Images from the same patient as in Figure 1 are shown.There are at least two circumscribed hypoechoic lesions in the lower region of the breast on the reconstructed coronal plane (Z) of this anterior-posterior (AP) view. The larger more superficial located lesion is in focus on the transverse plane (X). The layer of image-slices in the middle and right portion of the figure demonstrates the transverse plane (X) as the acquired set of images that allows for reconstruction of the two other planes, sagittal (Y) and coronal (Z). The lesion in focus on the transverse plane (X) is also in focus on the reconstructed sagittal plane (Y) and is identifiable as more superficial then the other lesion that is seen in the upper region of the breast on the same sagittal image.
Basic principles in image interpretation
Image interpretation by using AUS-integrated-software
One method to begin the AUS image interpretation is to read both AP-view coronal planes, right and left, sideby- side. Starting at the skin level, scrolling through the reconstructed tissue layers allows for a rapid overview of the anatomic representation. In a bilateral comparison the image findings can be identified by sweeping through the planes towards the chest level (Fig. 3).
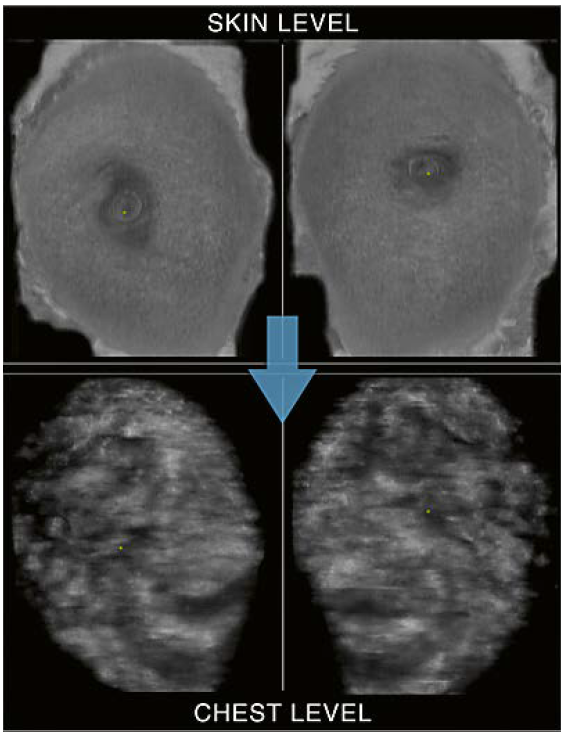
3 Use of hanging protocols: Coronal plane side-by-side mode. Starting at the skin level with the right and left coronal planes side-by-side allows for a time saving bilateral interpretation of the anatomy and findings by scrolling through the reconstructed layers towards deeper levels (symbolized by the arrow). At the chest level the pectoralis muscles and rib cage can be identified.
During the first cycle of viewing the
images, the coronal side-by-side mode enables the bilateral presentation of the
anatomy and an overview of findings. Passing the chest level in an upward
direction, an area of interest can be further examined in more detail by
switching the hanging protocol to the 3 planes in 1 view mode (Fig. 4).

4 Use of hanging protocols: Coronal plane side-by-side (coronal side-by-side) and 3 planes in 1 view (3- in-1- view) modes. If an area of interest is focused on the coronal plane, a switch to the 3-in-1-view mode can reveal further details (arrow). In the example shown, the area in crosshairs on the coronal side-by-side is resolved on the 3-in-1-view mode. The targeted area on the coronal plane (Z) may be perceived as an oval circumscribed lesion when only the coronal plane is interpreted. When switched to the 3-in-1-view it becomes apparent that the region in focus represents a fat lobule and summation of cooper ligaments as recognized on the transverse (X) and sagittal (Y) planes, rather than a circumscribed lesion.
In addition to using the interpretation
software to navigate AUS studies, the software includes tools to manipulate the
images in real-time. There are a number of integrated tools to support the
assessment of AUS exams. Specifically, the Zoom-tool and the Rotate-tool are
useful instruments for further lesion characterization, especially on the
acquired transverse plane. Figure 5 demonstrates the use of the Zoom-tool to
magnify an area of interest.
In other instances, the rotational tool can be helpful to interpret image findings. By simulating tilting and rotating of a HH probe in real-time, an area of interest can be further evaluated, such as in cases of conspicuous breast duct findings (Fig. 6).
 | 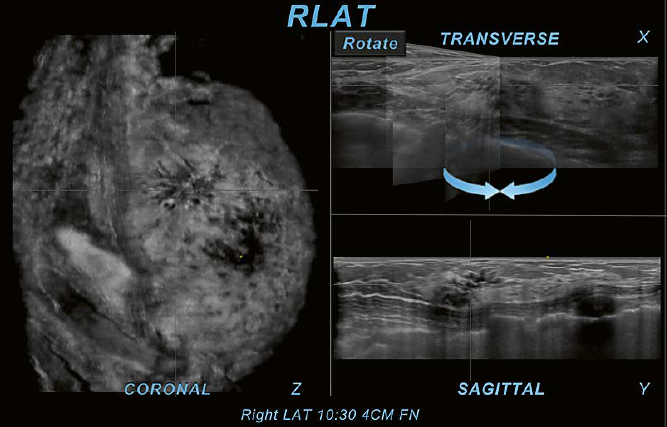 |
5 Use of software tools: Zoom-tool. The Zoom-tool is one of the provided software tools that allows magnification of findings within the interpretation software on the PACS workstation. In this case of a 31-year-old woman with left upper outer quadrant pain, the Zoom-tool is used on the transverse plane (X). The cystic area in crosshairs is located in the upper outer region as identified on the coronal plane (Z). On the sagittal plane (Y) the same area is also identifiable as in the upper region. The use of the Zoom-tool on the acquired plane can increase the confidence to judge the area of interest as a cluster of cysts. The magnification demonstrates only cyst walls without identification of an internal mass or other suspicious findings. This observation allows for a BI-RADS 2 assessment without the necessity for further workup. If this was assessed as BI-RADS 3, then follow-up examinations may also exclude a malignancy. This case was assessed as BI-RADS 2 without a false negative result. | 6 Use of software tools: Rotate-tool. Here a case of a 43-year-old woman recalled from screening mammography for an asymmetry is shown. There is an area of questioned architectural distortion (AD) and convoluted ducts seen on the coronal plane (Z). The Rotate-tool used on the transverse plane (X) helps the interpreter to follow the tubular structures and identify them as discrete tortuous ducts with associated AD. Due to the associated AD and growth of the area during follow up, the finding was assessed as BI-RADS 4B and recommended for US-guided core biopsy. Histo-pathology yielded flat epithelial atypia (FEA), columnar cell change, apocrine metaplasia, and fibrosis and surgical consultation was recommended. |
Benefits of the coronal plane
The coronal plane can provide an overview of all covered breast tissue in one single view. When displayed side-by side this plane is best for representing the breast anatomy and for rapid recognition of findings. As an example, the radial array of ducts entering the nipple is easily recognized as well as the echogenicity distribution patterns in correlation to the breast composition patterns in mammography. The reconstructed plane facilitates immediate recognition of masses, perceived as holes, and supports judgement of bilateral distribution and multiplicity of findings (Fig. 7). Especially architectural distortion (AD) can easily be identified, for instance recognizable as spiculation in cases of AD involving a malignancy. The conspicuity of AD seen on the coronal plane can be similar to that seen on tomosynthesis.
Image finding resolution
Shadowing is a challenging entity in AUS interpretation.Because of US inherited principles there are a number of reasons that can cause the appearance of shadowing on US images. Some of these reasons are due to US technique and can be artifact, such as ringdown artifact due to a small air bubble between the scanner probe and the skin.
Other underlying reasons can be indicators of a true abnormality, such as posterior shadowing of a malignant mass or shadowing due to a surgical scar [5]. Differentiation of particular types of shadowing on AUS can lead to the classification of a finding as an artifact or indicate a true abnormality (Fig. 8). The distinction of findings between artifact and true abnormality can decrease false positive recommendation (FP) such as the recommendation to recall a patient from screening. Distinguishing between true abnormalities not needing further workup, e.g., surgical scar, and suspicious abnormalities, e.g., posterior shadowing associated to a malignancy, can further influence the FP-rate and therefore positive predictive values of physician’s recommendation.
Principles to resolve shadowing as a challenging entity
Utilize additional planes to resolve shadowing
Image findings seen on the coronal plane can at times be inconclusive in assessment without utilization of additional planes. In Figure 9 the coronal plane shows an irregular hypoechoic area in the upper region of the breast. If only the coronal plane would be interpreted, the targeted area could represent shadowing associated with an irregular mass. In cases like this, utilization of an additional plane, either the acquired transverse or reconstructed sagittal plane, may help to distinguish between a suspicious and a benign finding. In the case of Figure 9, the use of a second plane clearly reveals the typical pattern of hyperechoic and anechoic horizontal lines originating at the skin with posterior shadowing seen on both additional planes, the transverse as well as the sagittal planes. By identifying this pattern as ringdown, the finding is classified and resolved as an artifact that is caused by interrupted contact between the transducer and the skin because of trapped air while scanning. This artifact can be minimized by an optimal scanning technique and careful application of lotion during the scanning process [5, 9].
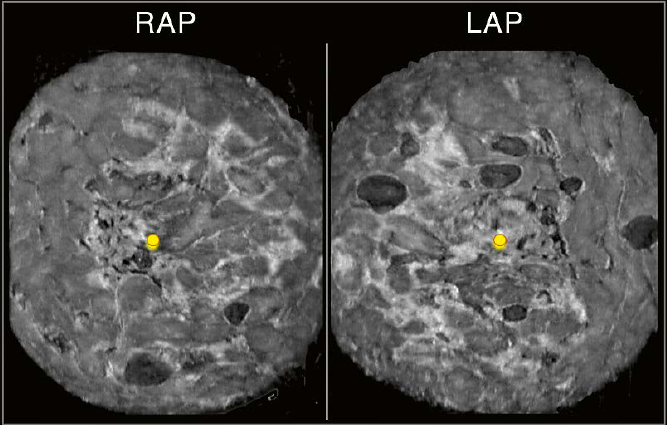 | 7 Coronal plane. Shown is the right (R) and left (L) anterior-posterior (AP) coronal plane of the same patient as in figure 1 and 2. The bilateral distribution of the multiple masses is easy to appreciate on both coronal planes side-by-side. The use of the reconstructed plane allows for characterization of the presented findings as multiple bilateral similar-appearing circumscribed masses. A BI-RADS 2 category assessment may be appropriate according to published studies supported by ACRIN 6666 data with no malignancies found with at least 2 years of follow-up [7]. “Multiple bilateral masses” is defined here as at least 3 masses in total and at least one per breast [8]. |
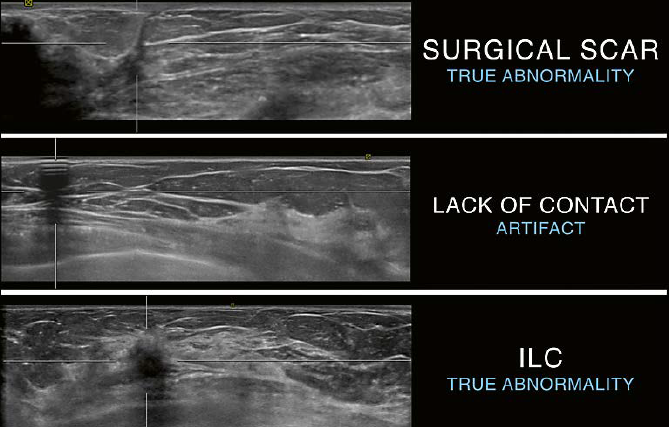 | 8 Differentiation of shadowing on AUS as indicator for a true abnormality or an artifactua finding. Top: linear shadowing originating at the skin and leading towards the chest level. The appearance is classic for a surgical scar and represents the surgical pathway leading to an excision site. The shadowing is caused by a true abnormality. Middle: shadowing with the typical appearance of alternating hyperechoic and anechoic horizontal lines originating at the skin with posterior shadowing. This pattern confirms ringdown as the cause of shadowing and confirms the presence of an artifact. Bottom: posterior shadowing due to a malignant mass. Due to attenuation of the ultrasound beam passing through a malignant mass shadowing can be seen posterior to the mass as in this example of an invasive lobular carcinoma (ILC). |
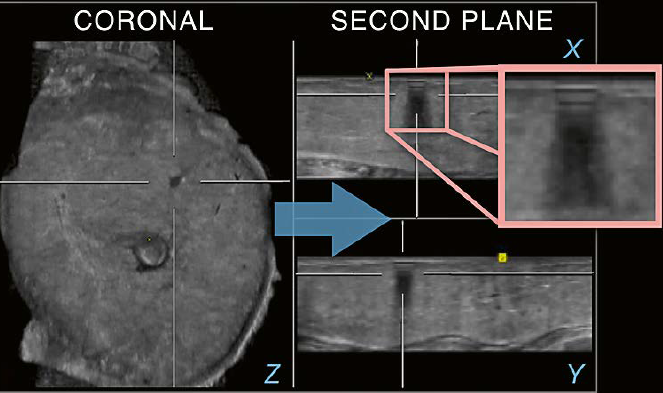 fffffffffffffffffffffffffffffffffffffffffffffffffffffffffffffffffffffffffffffffffffffffffff | 9 Utilization of an
additional plane. There is an irregular appearing hypoechoic area in the upper
region of the breast seen on the coronal plane (Z). When an additional plane is
used (arrow), the finding is clearly resolved as an artifact due to the
identification of ringdown on the transverse (X) as well as the sagittal (Y) planes.
The typical pattern of ringdown is recognized on the magnification overlaying
the transverse plane (square). |
Utilize a second view to resolve shadowing
In Figure 10, there is shadowing seen on all three planes on the right AP view (RAP). The shadowing seen in the peripheral region of the RAP view coronal plane is also identified on the RAP transverse and sagittal planes. An underlying suspicious finding cannot be excluded by solely using additional planes as shown in the prior example of ringdown artifact. In cases like this, utilization of a second view can support differentiation of an artifact from a true abnormality and potentially avoid false positive recalls.
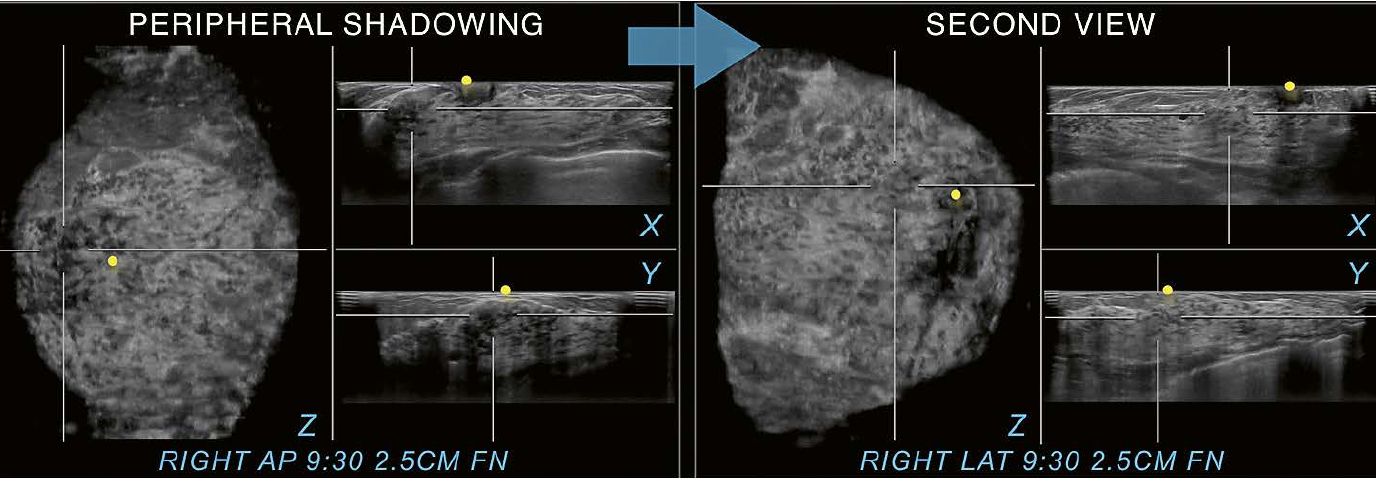
10 Utilization of a second
view. Peripheral shadowing is seen on the right AP view coronal plane at the 9:30
position 2.5 cm from the nipple (FN) in this case of a 36-year-old woman with
dense breast tissue.The shadowing is also present on both other RAP
planes, the RAP transverse and sagittal planes. When the right lateral
(LAT) view is selected as a second view to display (arrow), only normal
fibroglandular tissue is found in the same position as on the
anterior-posterior scan. The second view resolves the peripheral shadowing seen
on RAP as artifactual rather than as shadowing caused by an underlying
suspicious lesion.The peripheral shadowing now seen at 6 o’clock on the right
LAT view coronal plane was resolved in the same way as just demonstrated
with the 9:30 o’clock RAP view coronal plane shadowing. Yellow circles mark
the nipple region.
Figure
11 illustrates another case utilizing a second view. The peripheral shadowing
on the RAP view is again recognized on all three planes. Exclusion of a
suspicious finding is again difficult when only this view is interpreted.
However, when switched to the second view, the image finding in the same
location becomes clearly identifiable as a benign finding. The rim eggshell
calcification with posterior shadowing is diagnostic for fat necrosis. Here,
the second view helps to classify a true abnormality as a benign finding.
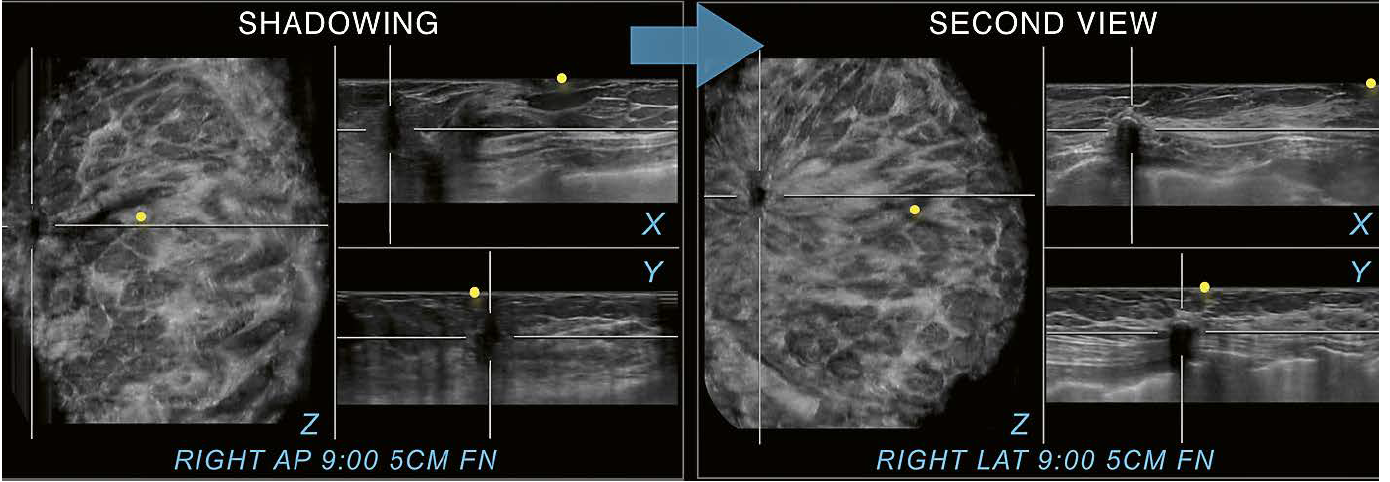
11 56-year-old woman with a history of a lumpectomy on the right. Excisional biopsy ten years ago yielded invasive mammary carcinoma and ductal carcinoma in situ grade 1. The patient returns for diagnostic follow up with shown images. Shadowing next to a surgical scar is seen on all three planes on this RAP view and a recurrence is difficult to exclude. Switching to the second view however allows for identification of the same finding in the same location at 9:00 o’clock and 5 cm FN as fat necrosis. Therefore, the case can appropriately be assessed as BI-RADS 2 and the patient can return to screening. Yellow circles mark the nipple region.
In
comparison, Figure 12 shows shadowing originating from a malignant mass. The
shadowing seen posterior to the mass is due to attenuation of the ultrasound
beam. The second view confirms the presence of an irregular hypoechoic mass
with posterior shadowing and associated AD. As seen in the examples of Figures
10 to 12, utilization of a second view can help to distinguish a true lesion
from an artifactual finding. Accurate classification of shadowing as
artifactual and not caused by a suspicious finding may lead to a lower FP-rate
and thus increase the positive predictive value of recommendations.
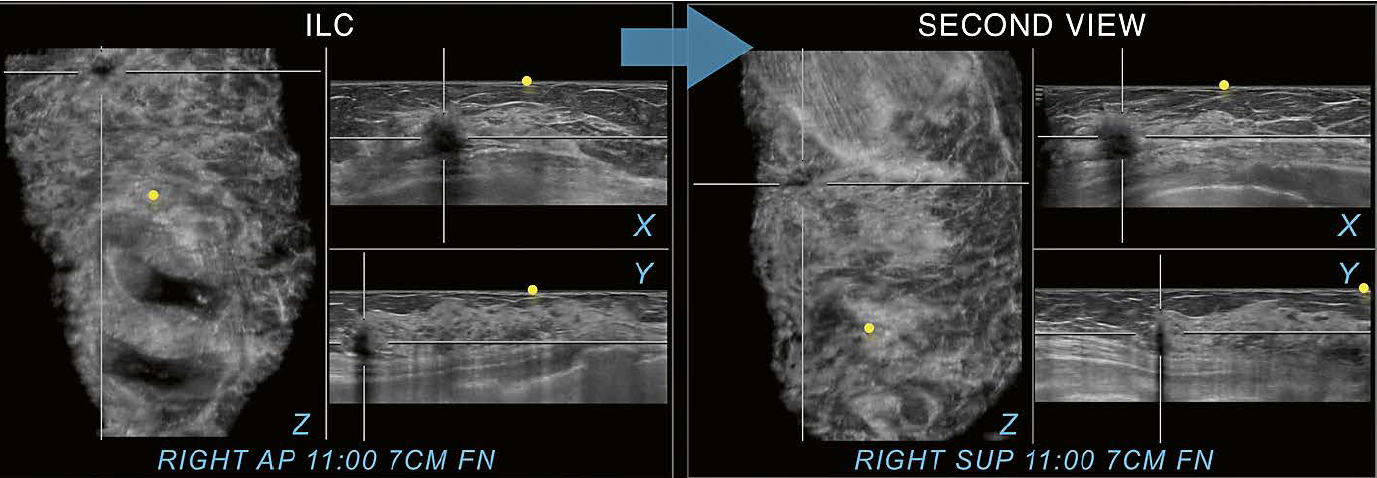
12 Invasive lobular carcinoma (ILC) for comparison. The shadowing caused by a malignant mass is seen in all three planes on the right AP view at 11:00 o’clock 7 cm FN. The right superior view (SUP) as a second view (arrow) supports identification of the same image findings in the same location as seen on the AP view and therefore confirms the finding as associated to a true abnormality. The example illustrates the difference in appearance between shadowing associated with a malignancy and shadowing caused by dense breast tissue in the periphery of a scan, that can be resolved on the second view as shown in figure 10. Yellow circles mark the nipple region.
Conclusion
Over the last decade automated breast ultrasound (AUS) and digital breast tomosynthesis (DBT) were added to complement three-dimensional modalities available to breast imagers. With an increase in three-dimensional (3D) spatial resolution at AUS and DBT, breast cancer detection may also increase. Nonetheless, adoption of these 3D modalities into daily practice includes reading of additional volumetric imaging information and a potential need to resolve artifacts. In an effort to reduce preventable false-positive recommendations and to resolve findings, utilization of a methodical approach can help differentiate benign from malignant findings on AUS. Identifying the factors which influence the false positive rate, and therefore positive predictive values, may lead to higher accuracy in automated breast ultrasound image interpretation during its more widespread integration into the breast imaging practice.
References
- Dempsey PJ. The history of breast ultrasound. J Ultrasound Med 2004; 23:887-894.
- Maturo VG, Zusmer NR, Gilson AJ, et al. Ultrasound of the whole breast utilizing a dedicated automated breast scanner. Radiology 1980; 137:457-463.
- Wojcinski S, Farrokh A, Hille U, et al. The Automated Breast Volume Scanner (ABVS): initial experiences in lesion detection compared with conventional handheld B-mode ultrasound: a pilot study of 50 cases. Int J Womens Health 2011; 3:337-346.
- Hooley RJ, Durand MA, Philpotts LE. Advances in Digital Breast Tomosynthesis. AJR Am J Roentgenol 2017; 208:256-266.
- Karst I, Henley C, Gottschalk N, Floyd S, Mendelson EB. Three-dimensional Automated Breast US: Facts and Artifacts. Radiographics 2019:180104.
- Vourtsis A, Kachulis A. The performance of 3D ABUS versus HHUS in the visualisation and BI-RADS characterisation of breast lesions in a large cohort of 1,886 women. Eur Radiol 2018; 28:592-601.
- Berg WA, Zhang Z, Cormack JB, Mendelson EB. Multiple bilateral circumscribed masses at screening breast US: consider annual follow-up. Radiology 2013; 268:673-683.
- Leung JW, Sickles EA. Multiple bilateral masses detected on screening mammography: assessment of need for recall imaging. AJR Am J Roentgenol 2000; 175:23-29.
- van Zelst JCM, Mann RM. Automated Three-dimensional Breast US for Screening: Technique, Artifacts, and Lesion Characterization. Radiographics 2018:170162.


