
![Tuberculosis Diagnostics: The Promise of [18F]FDT PET Imaging](https://res.cloudinary.com/healthmanagement-org/image/upload/c_thumb,f_auto,fl_lossy,h_184,q_90,w_500/v1721132076/cw/00127782_cw_image_wi_88cc5f34b1423cec414436d2748b40ce.webp "Tuberculosis Diagnostics: The Promise of [18F]FDT PET Imaging")


HealthManagement, Volume 15, Issue 2/2013
By Timothy R. Huerta, Mark A. Thompson, Eric W. Ford, William F. Ford
To realise productivity and efficiency gains from computers in healthcare settings, managers have to re-engineer the hospital to match workflows with the capabilities of those systems. This study explored productivity differences among US hospitals who employed differential approaches to electronic laboratory order entry and management (eLAB) systems.
Electronic laboratory order entry and management (eLAB) systems provide important opportunities for technology to play a transformative role in the provision of care. eLABs are benefitted by four characteristics that support this transformation:
1. eLABs have a well-defined ontological system (i.e., HL7) that lends itself to computerization and standardization.
2. The large volume of such tests coupled with their high costs makes these procedures a good target for systemic savings through better information management and waste reduction.
3. eLAB technologies are sufficiently mature and cost effective.
4. eLAB systems have been positioned as the foundation upon which EHRs are implemented, often serving as a leadingedge
indicator of technological adoption among non-computerized facilities.
In spite of these benefits, it is interesting that as of 2009, eLAB systems have not been widely implemented throughout US hospitals.
At a broader level, the absence of electronic medical records in hospitals throughout the US has prompted incentive programmes to support rapid adoption of EMR systems that include eLABS. However, it is unclear how implementing eLAB systems in short time frames impacts hospitals’ productivity levels, and the studies to date have found mixed results at best.
Our research, then, sought to clarify the implications of externally accelerated eLAB adoption on organisational productivity. As part of that process, we developed a taxonomy of adoption based on the change in percentage of orders processed using eLAB systems across two points in time - 2007 to 2008. Using the Malmquist Total Factor Productivity (TFP) Index and its underlying factors (viz., Technical Efficiency Change (TE) and Technological Change (TC)), facility relative productivity levels
were measured and compared.
The subject of this research focuses on the use of eLAB systems for ordering of diagnostic tests that are conducted in a controlled manner such as imaging and haematology. eLAB systems provide a framework to capture and communicate laboratory data in order to reduce the likelihood of redundant tests while supporting timely decision-making. These systems
are also a necessary component in achieving US policy aims of automating public health registry reporting and providing patients with test results that can be stored in an electronic personal health record.
“routinely order laboratory or other tests electronically.” The answer set was anchored at ‘0%’, and had options of ‘1-24%; ’25-49%’; ’50-74%; and ’75-100%’. In 2008, hospitals were asked the same question. Based on changes in the percentage of lab orders entered from one year to the next, a taxonomy of adoption trajectory was created (Table 1). The taxonomy is constructed around 9 groups in three categories:
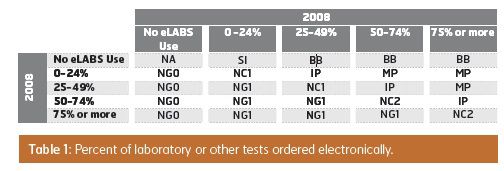
2. “Incremental Progress” (IP: n=74): reporting a 25 percent or less increase in usage from one year to the next.
3. “Major Progress” (MP: n=31): reporting a significant increase in eLAB system use with a two- (26 percent or more) or three-step (51 percent or more) increase in eLAB usage
4. “Big Bang” (BB: n=60): reporting a transition from no usage to usage greater than 50 percent in the single year
6. “No Change, minimal users” (NC1: n=312): reported less than 50 percent usage in 2007 and ‘No Change’ in adoption level in the usage of the system in the next year.
7. “No Change, meaningful users” (NC2: n=190): reported more than 50 percent usage in 2007 and ‘No Change’ in adoption level in the usage of the system in the next year.
9. “Reduced Use” (NG1: n=37): reported a decrease in eLAB system utilisation, but not a complete abandonment of the
technology.
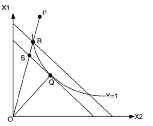
Figure 1: A graphic representation of efficiency
in a longitudinal framework based on the impact of management (TE) and the tools and technology brought to bear (TC). Figure 1, adapted here from the work of McGlynn and colleagues, provides a more in-depth illustration of the linkage between efficiency and the frontier. The figure illustrates the case of a single output (Y) that is produced using two inputs (X1, X2), and that the production function, Y=f(X1,X2) is linearly homogenous. As such, Figure 1 represents the trade-offs made between
consumption of X1 and X2 in the production of a single unit of Y. Q represents a decision-making unit that is efficient, that is, it lies on the frontier of efficient outputs given the multitude of input combinations possible. P represents a decision-making unit that requires higher levels of inputs to produce a single unit of Y. The magnitude of the efficiency can be expressed as the ratio between optimal and actual resource use (OR/OP).
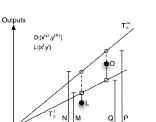
Figure 2: Components of the Malmquist
The Malmquist Total Factor Productivity (TFP) Index extends this logic across time. In figure 2, we illustrate the productivity of a decision-making unit at time t (L on the figure) and t+1 (O on the figure). On visual inspection, it would seem that the decision-making unit has become more efficient at time t+1, in part because over twice the output is being produced with only a marginal increase in the input. However, it is important to contextualise the advancement of others in that same time. If other organisations are tripling their productivity while the one illustrated only doubles in the same time period, then it is not truly efficient. In this way, the Malmquist focuses on best demonstrated practice as the benchmark for each time period
against which performance is measured and returns an numerical index centered on 1, where positive and negative values correspond to whether the decision-making unit advanced or retreated against the shift in the technology benchmark created by other comparative decision making units, respectively.
The Malmquist index can also be broken down in into components that offer measures of Technical Efficiency (TE) and Technical Change (TC). Technical Efficiency is an indicator of the ‘management effect’ on organisational performance. It measures when more of each input is used than should be required to produce a given level of output in specific organizational activities. It is typically attributed to insufficient competitive pressures that allow management to engage in suboptimal productivity. Under competitive pressure, managers are incentivised to improve their underlying organisational processes in order to keep pace with other firms in the market through innovation. On the other hand, the Technical Change index measures shifts that arise from organisational innovation. It is interpreted as the change of the “best practice” frontier over time typically due to improvements in the “technology” of organisational processes.
We focused on facility usage for our output measures. We included the number of surgical outpatient procedures (SUROPTOT) in order to identify facilities with heavy outpatient surgical loads. Adjusted admissions were multiplied by Case Mix Index (CMI) to calculate a CMI-adjusted admission count for the facility (ADJADM * CMI). Since staffing level data does not distinguish between inand out-patient staffing, AHA reports adjusted patient days of care to take into account the outpatient care provided by the hospital. CMI was taken from the public data file from CMS for each year and reconciled against Medicare Number (MCRNUM). In order to capture the average daily census, the length of stay (ADJPD – ADJADM) was used to balance the case-adjusted admissions. Our final output measures include the volume of emergency room visits (VEM) and outpatient encounters (VTOT) since they consume hospital resources.
This study pulled data from the American Hospital Association’s (AHA’s) Annual Survey for fiscal years 2005 through 2008
(sample size availability: 2005: n = 6349; 2006: n = 6346; 2007: n = 6312; 2008: n =6407). The datasets were merged, cleaned,
and cross-validated in Microsoft Excel. The authors limited the sample to facilities with complete data over the entire time span resulting in 2,849 hospitals with complete responses for the four years. DEAP was used to calculate the TFP, TE and TC measures.
Overall, this analysis may indicate that hospital employees are working harder (i.e., increasing efficiency gains), but not necessarily smarter (i.e., effectively deploying new technologies) for minor gains in overall productivity. One alternative is that hospitals may be expanding the number of licensed beds to gain economies of scale that would increase efficiency, but not influence TC. Due to the short time frame of the study, the former explanation is more plausible as a major change to physical structures are unlikely to have occurred in a widespread, systematic fashion.
Specific to implementation strategies, the high performing strategy is to implement the eLAB system on limited basis and then move to widespread use within a year as indicated by the group labeled ‘Major Progress’ (TC =1.044; TFP = 1.037). The ‘Simple Introduction’ approach did not have much of an impact on changes in efficiency and technology. Given the ‘Simple-Introduction’ tactic is the first step in the ‘Major Progress’ strategy, this evidence provides additional support that a limited introduction followed by a rapid expansion may be a better approach than say the ‘Big Bang’ approach (TFP = 0.983). Finally, the slowly staged roll-out strategy (i.e., Incremental Progress) is also sub-optimal to other approaches (TFP = 0.996). This approach is comparable to the ‘stuck-in-the-middle’ problem firms face when they pursue multiple strategies in marketing products to consumers.
While we should note that hospitals that had not responded to inquiries on the eLABS status were significantly higher on the TE measure, responders had a systematically higher score on the TC measure. However, there was no difference in TFP between responders and non-responders. If one assumes that nonresponders are less likely to have implemented an eLAB system application, then adopting the new technology appears to have an adverse impact on efficiency in the near term.
This interpretation is consistent with the assumption that non-respondents are more likely to be non-adopters of eLAB system technology and therefore face no short-term performance losses.
Since implementing an eLAB system requires a rethinking of job processes and employees’ roles and responsibilities (i.e., scope of practice) as well as organisational hierarchy, the move to a fully integrated and functional EHR could impact TC favorably. However, some organisations keep their same processes and structures because the necessary changes are time consuming and could adversely impact hospitals’ efficiency levels in the near-term. The results suggest that when eLAB system implementations occur too quickly (e.g., the Big Bang), efficiency and productivity are adversely impacted. Instead, facilities may want to consider a Major Progress strategy as a means of qualifying for federal rewards and avoiding future
penalties vis-à-vis other options..
Departments of Family Medicine and Biomedical Informatics
The Ohio State University
[email protected]
The University of North Carolina Greensboro
Middle Tennessee State University
To realise productivity and efficiency gains from computers in healthcare settings, managers have to re-engineer the hospital to match workflows with the capabilities of those systems. This study explored productivity differences among US hospitals who employed differential approaches to electronic laboratory order entry and management (eLAB) systems.
Electronic laboratory order entry and management (eLAB) systems provide important opportunities for technology to play a transformative role in the provision of care. eLABs are benefitted by four characteristics that support this transformation:
1. eLABs have a well-defined ontological system (i.e., HL7) that lends itself to computerization and standardization.
2. The large volume of such tests coupled with their high costs makes these procedures a good target for systemic savings through better information management and waste reduction.
3. eLAB technologies are sufficiently mature and cost effective.
4. eLAB systems have been positioned as the foundation upon which EHRs are implemented, often serving as a leadingedge
indicator of technological adoption among non-computerized facilities.
In spite of these benefits, it is interesting that as of 2009, eLAB systems have not been widely implemented throughout US hospitals.
At a broader level, the absence of electronic medical records in hospitals throughout the US has prompted incentive programmes to support rapid adoption of EMR systems that include eLABS. However, it is unclear how implementing eLAB systems in short time frames impacts hospitals’ productivity levels, and the studies to date have found mixed results at best.
Our research, then, sought to clarify the implications of externally accelerated eLAB adoption on organisational productivity. As part of that process, we developed a taxonomy of adoption based on the change in percentage of orders processed using eLAB systems across two points in time - 2007 to 2008. Using the Malmquist Total Factor Productivity (TFP) Index and its underlying factors (viz., Technical Efficiency Change (TE) and Technological Change (TC)), facility relative productivity levels
were measured and compared.
Background on ELAB Systems
eLAB systems are a component of a broader class of tools called Computerized Provider Order Entry (CPOE) systems that were first introduced in 1969 and have been evolving slowly ever since. There are three major classes of CPOE systems. The most frequently discussed is electronic prescribing (ePrescribing or eRx), which has a longer and more prolific presence in US healthcare because of the focus on patient safety, and the significant role medication errors play in compromising care quality. The standardisation of clinical order set entry and use is another class of CPOE, but has been the slowest to take hold due to the difficulty of moving physicians away from their traditional practice and towards standardised regiments of care.The subject of this research focuses on the use of eLAB systems for ordering of diagnostic tests that are conducted in a controlled manner such as imaging and haematology. eLAB systems provide a framework to capture and communicate laboratory data in order to reduce the likelihood of redundant tests while supporting timely decision-making. These systems
are also a necessary component in achieving US policy aims of automating public health registry reporting and providing patients with test results that can be stored in an electronic personal health record.
Taxonomy of eLAB System Adoption Rates
In 2007, the American Hospital Association asked its members to categorise the percentage of physicians in the facility that“routinely order laboratory or other tests electronically.” The answer set was anchored at ‘0%’, and had options of ‘1-24%; ’25-49%’; ’50-74%; and ’75-100%’. In 2008, hospitals were asked the same question. Based on changes in the percentage of lab orders entered from one year to the next, a taxonomy of adoption trajectory was created (Table 1). The taxonomy is constructed around 9 groups in three categories:
Advancement
1. “Simple Introduction” (SI: n=94): reported no eLAB system usage in 2007 and less than 25 percent usage in 20082. “Incremental Progress” (IP: n=74): reporting a 25 percent or less increase in usage from one year to the next.
3. “Major Progress” (MP: n=31): reporting a significant increase in eLAB system use with a two- (26 percent or more) or three-step (51 percent or more) increase in eLAB usage
4. “Big Bang” (BB: n=60): reporting a transition from no usage to usage greater than 50 percent in the single year
Stagnation
5. “Never Adopter” (NA: n=895): reported no system in place in either 2007 or 20086. “No Change, minimal users” (NC1: n=312): reported less than 50 percent usage in 2007 and ‘No Change’ in adoption level in the usage of the system in the next year.
7. “No Change, meaningful users” (NC2: n=190): reported more than 50 percent usage in 2007 and ‘No Change’ in adoption level in the usage of the system in the next year.
Regression
8. “Negative Growth to Zero” (NG0: n=60): reported abandoning all prior eLAB use9. “Reduced Use” (NG1: n=37): reported a decrease in eLAB system utilisation, but not a complete abandonment of the
technology.
Figure 1: A graphic representation of efficiency
Measuring Hospital Efficiency, Technological Change and Productivity
To measure hospital efficiency, we employed Data Envelopment Analysis (DEA), which differs from standard regression methods by establishing a frontier associated with bestdemonstrated practices and then building a metric based on that benchmark. An overarching measure of relative transformational efficiency is then created by using the average of this index across all decision-making units. Total Factor Productivity Analysis using DEA allows for comparisons of facilities with peersin a longitudinal framework based on the impact of management (TE) and the tools and technology brought to bear (TC). Figure 1, adapted here from the work of McGlynn and colleagues, provides a more in-depth illustration of the linkage between efficiency and the frontier. The figure illustrates the case of a single output (Y) that is produced using two inputs (X1, X2), and that the production function, Y=f(X1,X2) is linearly homogenous. As such, Figure 1 represents the trade-offs made between
consumption of X1 and X2 in the production of a single unit of Y. Q represents a decision-making unit that is efficient, that is, it lies on the frontier of efficient outputs given the multitude of input combinations possible. P represents a decision-making unit that requires higher levels of inputs to produce a single unit of Y. The magnitude of the efficiency can be expressed as the ratio between optimal and actual resource use (OR/OP).
Figure 2: Components of the Malmquist
The Malmquist Total Factor Productivity (TFP) Index extends this logic across time. In figure 2, we illustrate the productivity of a decision-making unit at time t (L on the figure) and t+1 (O on the figure). On visual inspection, it would seem that the decision-making unit has become more efficient at time t+1, in part because over twice the output is being produced with only a marginal increase in the input. However, it is important to contextualise the advancement of others in that same time. If other organisations are tripling their productivity while the one illustrated only doubles in the same time period, then it is not truly efficient. In this way, the Malmquist focuses on best demonstrated practice as the benchmark for each time period
against which performance is measured and returns an numerical index centered on 1, where positive and negative values correspond to whether the decision-making unit advanced or retreated against the shift in the technology benchmark created by other comparative decision making units, respectively.
The Malmquist index can also be broken down in into components that offer measures of Technical Efficiency (TE) and Technical Change (TC). Technical Efficiency is an indicator of the ‘management effect’ on organisational performance. It measures when more of each input is used than should be required to produce a given level of output in specific organizational activities. It is typically attributed to insufficient competitive pressures that allow management to engage in suboptimal productivity. Under competitive pressure, managers are incentivised to improve their underlying organisational processes in order to keep pace with other firms in the market through innovation. On the other hand, the Technical Change index measures shifts that arise from organisational innovation. It is interpreted as the change of the “best practice” frontier over time typically due to improvements in the “technology” of organisational processes.
Malmquist Model Specification and Dataset Description
Our analysis used three inputs and five outputs from the American Hospital Association’s (AHA) annual survey. Specifically, we selected total licensed beds (BDTOT) as a proxy for the size of the facility. The nursing staff was broken out as their own input by using both total FTE minus the nursing staff (FTE) and the total number of FTE in the licensed nursing staff (FTERN+FTELPN).We focused on facility usage for our output measures. We included the number of surgical outpatient procedures (SUROPTOT) in order to identify facilities with heavy outpatient surgical loads. Adjusted admissions were multiplied by Case Mix Index (CMI) to calculate a CMI-adjusted admission count for the facility (ADJADM * CMI). Since staffing level data does not distinguish between inand out-patient staffing, AHA reports adjusted patient days of care to take into account the outpatient care provided by the hospital. CMI was taken from the public data file from CMS for each year and reconciled against Medicare Number (MCRNUM). In order to capture the average daily census, the length of stay (ADJPD – ADJADM) was used to balance the case-adjusted admissions. Our final output measures include the volume of emergency room visits (VEM) and outpatient encounters (VTOT) since they consume hospital resources.
This study pulled data from the American Hospital Association’s (AHA’s) Annual Survey for fiscal years 2005 through 2008
(sample size availability: 2005: n = 6349; 2006: n = 6346; 2007: n = 6312; 2008: n =6407). The datasets were merged, cleaned,
and cross-validated in Microsoft Excel. The authors limited the sample to facilities with complete data over the entire time span resulting in 2,849 hospitals with complete responses for the four years. DEAP was used to calculate the TFP, TE and TC measures.
Results
A one-way Analysis of Variance (ANOVA) was used to evaluate the Malmquist TFP index across different adoption patterns (from responses to the AHA eLAB items). We found that linking TE (p = 0.071) and TC (p = 0.352) with eLAB system use level was not significant. However, there were statistically significant differences in the TFP indices for hospitals actively expanding the use of eLAB systems during the study period (p = 0.021) indicating some positive support related to greater levels of eLAB system use.Discussion
Over the four-year study period, hospitals were able to increase the output-to-input ratio, but were not able to advance their efforts to improve the underlying care processes (i.e.,TC). Due to the trade-off between the TE and TC factors, only minor gains in overall TFP took place over this time period.Overall, this analysis may indicate that hospital employees are working harder (i.e., increasing efficiency gains), but not necessarily smarter (i.e., effectively deploying new technologies) for minor gains in overall productivity. One alternative is that hospitals may be expanding the number of licensed beds to gain economies of scale that would increase efficiency, but not influence TC. Due to the short time frame of the study, the former explanation is more plausible as a major change to physical structures are unlikely to have occurred in a widespread, systematic fashion.
Specific to implementation strategies, the high performing strategy is to implement the eLAB system on limited basis and then move to widespread use within a year as indicated by the group labeled ‘Major Progress’ (TC =1.044; TFP = 1.037). The ‘Simple Introduction’ approach did not have much of an impact on changes in efficiency and technology. Given the ‘Simple-Introduction’ tactic is the first step in the ‘Major Progress’ strategy, this evidence provides additional support that a limited introduction followed by a rapid expansion may be a better approach than say the ‘Big Bang’ approach (TFP = 0.983). Finally, the slowly staged roll-out strategy (i.e., Incremental Progress) is also sub-optimal to other approaches (TFP = 0.996). This approach is comparable to the ‘stuck-in-the-middle’ problem firms face when they pursue multiple strategies in marketing products to consumers.
While we should note that hospitals that had not responded to inquiries on the eLABS status were significantly higher on the TE measure, responders had a systematically higher score on the TC measure. However, there was no difference in TFP between responders and non-responders. If one assumes that nonresponders are less likely to have implemented an eLAB system application, then adopting the new technology appears to have an adverse impact on efficiency in the near term.
This interpretation is consistent with the assumption that non-respondents are more likely to be non-adopters of eLAB system technology and therefore face no short-term performance losses.
Since implementing an eLAB system requires a rethinking of job processes and employees’ roles and responsibilities (i.e., scope of practice) as well as organisational hierarchy, the move to a fully integrated and functional EHR could impact TC favorably. However, some organisations keep their same processes and structures because the necessary changes are time consuming and could adversely impact hospitals’ efficiency levels in the near-term. The results suggest that when eLAB system implementations occur too quickly (e.g., the Big Bang), efficiency and productivity are adversely impacted. Instead, facilities may want to consider a Major Progress strategy as a means of qualifying for federal rewards and avoiding future
penalties vis-à-vis other options..
Authors:
Timothy R. Huerta
Associate ProfessorDepartments of Family Medicine and Biomedical Informatics
The Ohio State University
[email protected]
Mark A. Thompson
Associate Professor Rawls College of Business Texas Tech UniversityEric W. Ford
Forsyth Medical Center Distinguished Professor of ManagementThe University of North Carolina Greensboro
William F. Ford
Weatherford Chair of FinanceMiddle Tennessee State University
References:
References available upon request, [email protected]