HealthManagement, Volume 17 - Issue 1, 2017
 PRINT OPTIMISED
It can be said that the diagnostic imaging sector in Cyprus could observe constant growth in the coming years despite the negative impacts of the economic crisis given no changes in the healthcare scene. That view, coupled with the universal and constant demand for improved diagnostic tools, creates premise for reviewing the current market of Advanced Diagnostic Imaging (ADI) comprised of MRI and CT in Cyprus.
Cyprus is one of the leaders in numbers of CT and MRI scanners per 100,000 inhabitants (3.2 CT and 2.0 MRI scanners vs. 2.2 and 1.2 in the EU respectively). At first glance, it can be argued that this market is fully saturated; however, no data exist to support this claim. The only existing data in the Eurostat 2016 database involves only public sector activity showing disproportionately low usage.
Method
The purpose of this study was to provide an analysis of the current and future trends of the CT and MRI market in Cyprus, which can be used as a tool for strategic decision making in the field.
The study followed a twofold methodological process. Its first part consisted of an extensive review of the relevant literature followed by a field analysis, which included data collected from public services and private sources.
In order to obtain valid information regarding the current situation as well as the nature and magnitude of the activity in this particular area, key informants and major stakeholders of the sector were contacted. This approach helped us to extract extensive information on the matter, which was in many cases cross-checked with two or more key informants during this process.
Findings
CT and MRI Facilities
Cyprus is a leading country in numbers of CT and MRI scanners per 100,000 inhabitants (Table 1) (Eurostat 2016). Despite the fact that Cyprus was among the top countries in MRI units, it reported one of the lowest ratios in numbers of MRI scans (below 1,000 scans) per 100,000 inhabitants.
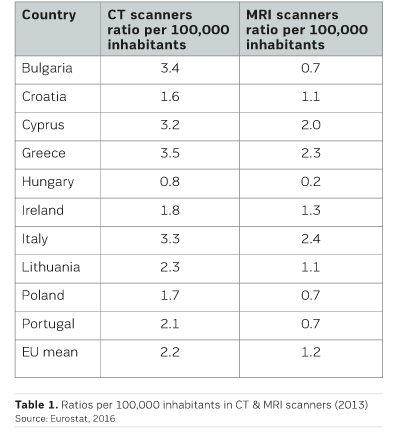
However, this view is inaccurate since the only examinations counted are those at the only MRI unit in the public sector, which are then related in a ratio with the total number of MRI units in both the private and the public sectors yielding a dramatically low and inaccurate ratio.
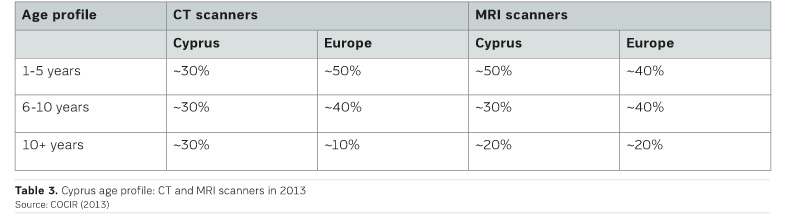
Table 2 presents the numbers of CT and MRI scanners in for the period of 2005-2016. At present there are 18 MRI units and 29 CT scanners in Cyprus. Cyprus had the highest percentage of ageing CT scanners in 2013 and did significantly better with respect to MRI units comparing to the rest of the European countries (Table 3).
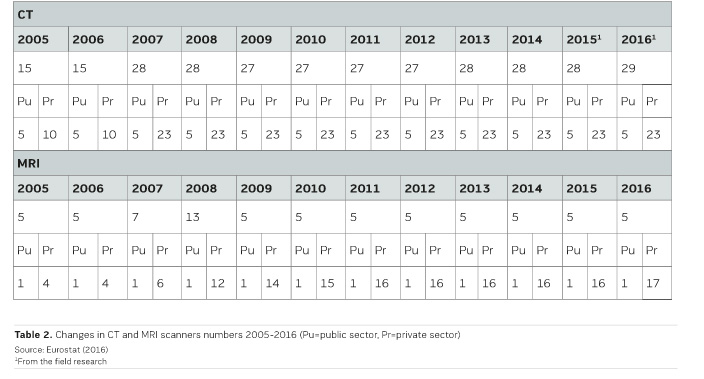
Although medical technology older than 10 years is considered outdated and difficult to maintain and repair, there is a trend in the private sector in Cyprus to acquire and commission used CT and MRI scanners. The situation is still controlled for MRI as a few of them are reconditioned, while others are upgraded after some years in operation. Concerning CT scanners, the situation is much worse since there were some really old scanners at the time (2013) both in the public and private sectors.
CT and MRI Activity
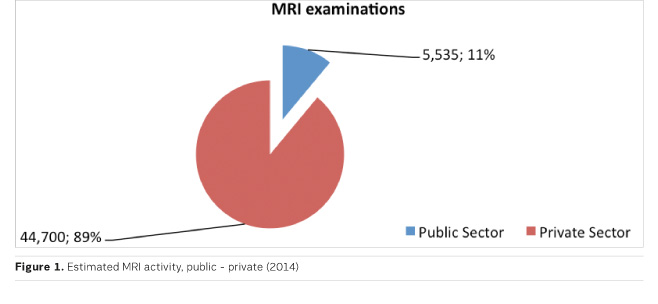
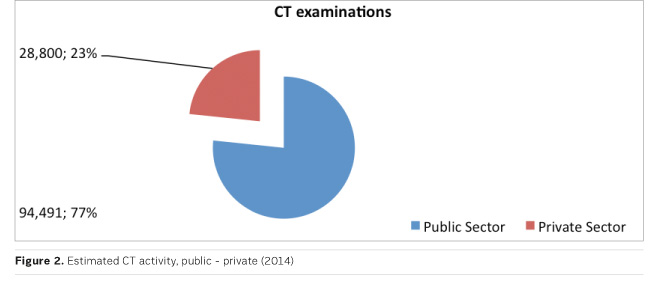
CT and MRI examinations carried out in the public sector (Table 4) are recorded by the Statistical Service (Republic of Cyprus Statistical Service 2016).
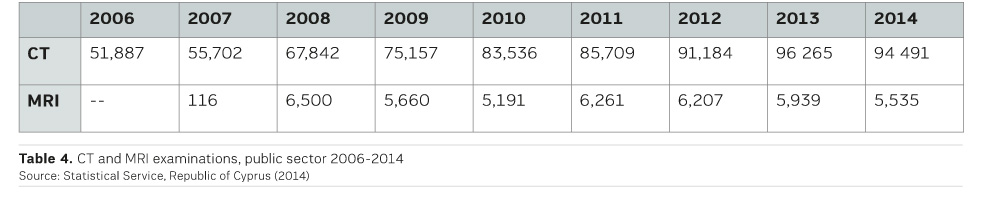
The figures were estimated by compiling 2014 data from Ministry of Health regarding the public sector and data collected for the private sector. Consequently this picture of the private sector should be evaluated as a rough overall indication since there are no official statistics. The level of uncertainty on these figures cannot be calculated.
It was estimated that the annual activity (public + private) of MRIs is approximately 50,000 examinations (89% private and 11% public) (Figure 1) while the corresponding activity of CTs to be approximately 123,000 examinations (23% private and 77% public) (Figure 2). This estimation is slightly higher than the EU mean, showing an underutilisation of the diagnostic imaging in private sector (Eurostat 2016).
The MRI market is dominated by the private sector while the CT market - by the public sector since the latter possesses only one MRI scanner. CT examinations in their vast majority concern referrals of public sector beneficiaries served by the six CT scanners of the public sector. This portrayal indicates an underutilisation of CT scanners in the private sector. Regarding the private sector, it can be noted that there is a concentration in MRI activity of more than 70% at 7 private providers while the remaining 11 are operating well below their capacity.
The price for a common and simple MRI examination can be as low as €190 today, whereas ten years ago it was nearly double this amount. This is attributed mainly to two factors: (a) the entrance of new ‘players’ with older units hence lower depreciation costs and (b) the gradual deterioration of the economy during the recent years that has limited consumers purchasing power and exerted pressure over the market to lower its prices.
CT and MRI Market Drivers
The absence of an integrated national health system affects the market in various ways. Shortcomings such as an unregulated market, lack of quality assurance and referral systems, induced demand practices, high prices, out-of-pocket payments, long waiting lists etc. could more easily be handled in a well-organized health system. In the current system, the majority of the public health beneficiaries choose to pay for imaging services in the private sector due to the shortcomings of the public sector. A significant number of patients opt for out-of-pocket private sector imaging services while some of the patients are privately insured.
The absence of control over the private sector by the state in conjunction with the lack of national guidelines and protocols regarding the referral of patients for diagnostic imaging investigations create favourable conditions for excessive use of such services and creation of artificial demand, based on the perceived need by the consumer and the opinion of treating physicians. In other words, it is relatively easy for a patient who feels it is necessary to have an imaging examination to obtain a referral by a private sector physician based only on his or hers perceived need. Moreover, a physician can easily request an imaging examination without considering all alternative options available.
Many private sector providers that operate in this market environment have emerged in the last decade. One distinct category of those private providers is that of physicians and other clinicians who collaborate by referring their patients to specific providers. Some of them are also major shareholders in these small or large private hospitals where the facilities are found. There can also be physicians with their own private practices who are shareholders in a certain facility or simply ‘join forces’ in supporting these facilities. The financial viability of these facilities is supported and, to an extent, ensured through the creation of a strong network of referring clinicians. One other distinct category of private sector providers is that of the relatively new entrants in the market of diagnostic imaging who focused on the pricing parameter, offering the lowest prices on the market for almost all the types of imaging examinations.
Today consumer attention lies with price; this has caused all providers to lower prices or offer discounts. For MRI the prices have been reduced by €100-150, depending on the examination. Regardless of the provider category, there is an informal system of ‘premium granting’ to clinicians referring their patients to the various providers of the private sector. This premium granting to referring clinicians is commonly referred to as ‘provision of medical services’ and is basically a payment of 10-30% commission on the price of the examination, depending on the type of examination requested. Although this activity does not appear to be illegal, it can be argued that it damages fair competition as it introduces a form of financial incentive for the referring clinicians and this can often not be in the patients’ best interest.
Conclusions
Cyprus has too many MRI and CT units in relation to its population and its needs. Despite the existence of a detailed legal framework, in practice there is significant flexibility. The absence of specific legislation regarding MRI units has created conditions for their installation without any indication.
The complete lack of activity data, forced us to look for ways of measuring the CT and MRI activity, conducting field research by visiting diagnostic centres, using personal contacts and key informants. Despite the practical difficulties, enough data was gathered on the activity of the private sector, although some was based on estimates by market experts.
Currently there is no monitoring and control over the clinical activity of the private sector. There are no referral protocols being utilised. This creates conditions for the rise in ‘artificial demand’.
The market seems to be driven by the prices as well as by the establishment of ‘alliances’ and the creation of physician referral networks. Despite the fact that these units operate well below their capacities, they still remain in the market without presenting any loss.
The introduction of a national health system in the near future is expected to have a positive effect on these shortcomings and hopefully introduce reforms needed in order to improve the current market environment.
Key Points
- CT and MRI market in Cyprus: trends and important
characteristics of the public and private sectors.
- CT and MRI Facilities in Cyprus: numbers, types and
age profiles of all modalities found in Cyprus.
- CT and MRI Activity in Cyprus: estimated number of
examinations in both sectors and factors affecting demand.
References:
Eurostat (2016) Healthcare resource statistics – technical resources and medical technology. [Accessed: 5 May 2016] Available from http://ec.europa.eu/eurostat/statisticsexplained/index.php/Healthcare_resource_statisticstechnical_resources_and_medical_technology#Availability_of_medical_technology
Republic of Cyprus Statistical Service (2014) Health Statistics 2014, Series I, report No. 35, March 2016. [Accessed: 5 May 2016] Available from http:// www.mof.gov.cy/cystat
Eurostat (2016) Healthcare resource statistics – technical resources and medical technology. [Accessed: 5 May 2016] Available from http://ec.europa.eu/eurostat/statisticsexplained/index.php/Healthcare_resource_statistics
Further reading:
Mercer (2013) Actuarial study of Cyprus national health expenditure and national health system, Health Insurance Organization
OECD (2014) Health at a Glance: Europe 2014, OECD Publishing. [Accessed: 5 May 2016] Available from http://dx.doi.org /10.1787/health_glance_eur-2014
OECD (2015) Health at a glance 2015, OECD indicators. [Accessed: 5 May 2016] Available from http://apps.who.int/medicinedocs/documents/s22177en/s22177en.pdf
The Official Gazette of the Republic of Cyprus (2013) Republic of Cyprus, Fees for healthcare services
The World Bank (2016) Data: Cyprus [Accessed: 5 May 2016] Available from http://data.worldbank.org/country/cyprus#cp_prop
COCIR (2014) Medical imaging equipment age profile and density: Cocir executive summary edition 2014