

A single breath curve in volumetric capnography exhibits three characteristic phases of changing gas mixtures. Learn more about anatomical dead space, the transition phase, and the plateau phase.
Introduction
Carbon dioxide (CO2) is the most abundant gas produced by the human body. CO2 is the primary drive to breathe and a primary motivation for mechanically ventilating a patient. Monitoring the CO2 level during respiration (capnography) is noninvasive, easy to do, relatively inexpensive, and has been studied extensively.
Capnography has improved over the last few decades thanks to the development of faster infrared sensors that can measure CO2 at the airway opening in real time. By knowing how CO2 behaves on its way from the bloodstream through the alveoli to the ambient air, physicians can obtain useful information about ventilation and perfusion.
There are two distinct types of capnography: Conventional, time‑based capnography allows only qualitative and semi‑quantitative, and sometimes misleading, measurements, so volumetric capnography has emerged as the preferred method to assess the quality and quantity of ventilation.
Benefits of volumetric capnography
- Improves, simplifies, and complements patient monitoring in relation to metabolism, circulation, and ventilation (V/Q)
- Provides information about the homogeneity or heterogeneity of the lungs
- Trend functions and reference loops allow for more comprehensive analysis of the patient condition
- Multiple clinical applications, such as detection of early signs of pulmonary emboli, COPD, ARDS, etc.
- Helps you optimize your ventilator settings
- Is easy to do and is relatively inexpensive
In short, volumetric capnography is a valuable tool to improve the ventilation quality and efficiency for your ventilated patients.
The three phases of the volumetric capnogram
The alveolar concentration of carbon dioxide (CO2) is the result of metabolism, cardiac output, lung perfusion, and ventilation. Change in the concentration of CO2 reflects perturbations in any or a combination of these factors. Volumetric capnography provides continuous monitoring of CO2 production, ventilation/perfusion (V/Q) status, and airway patency, as well as function of the ventilator breathing circuit itself.
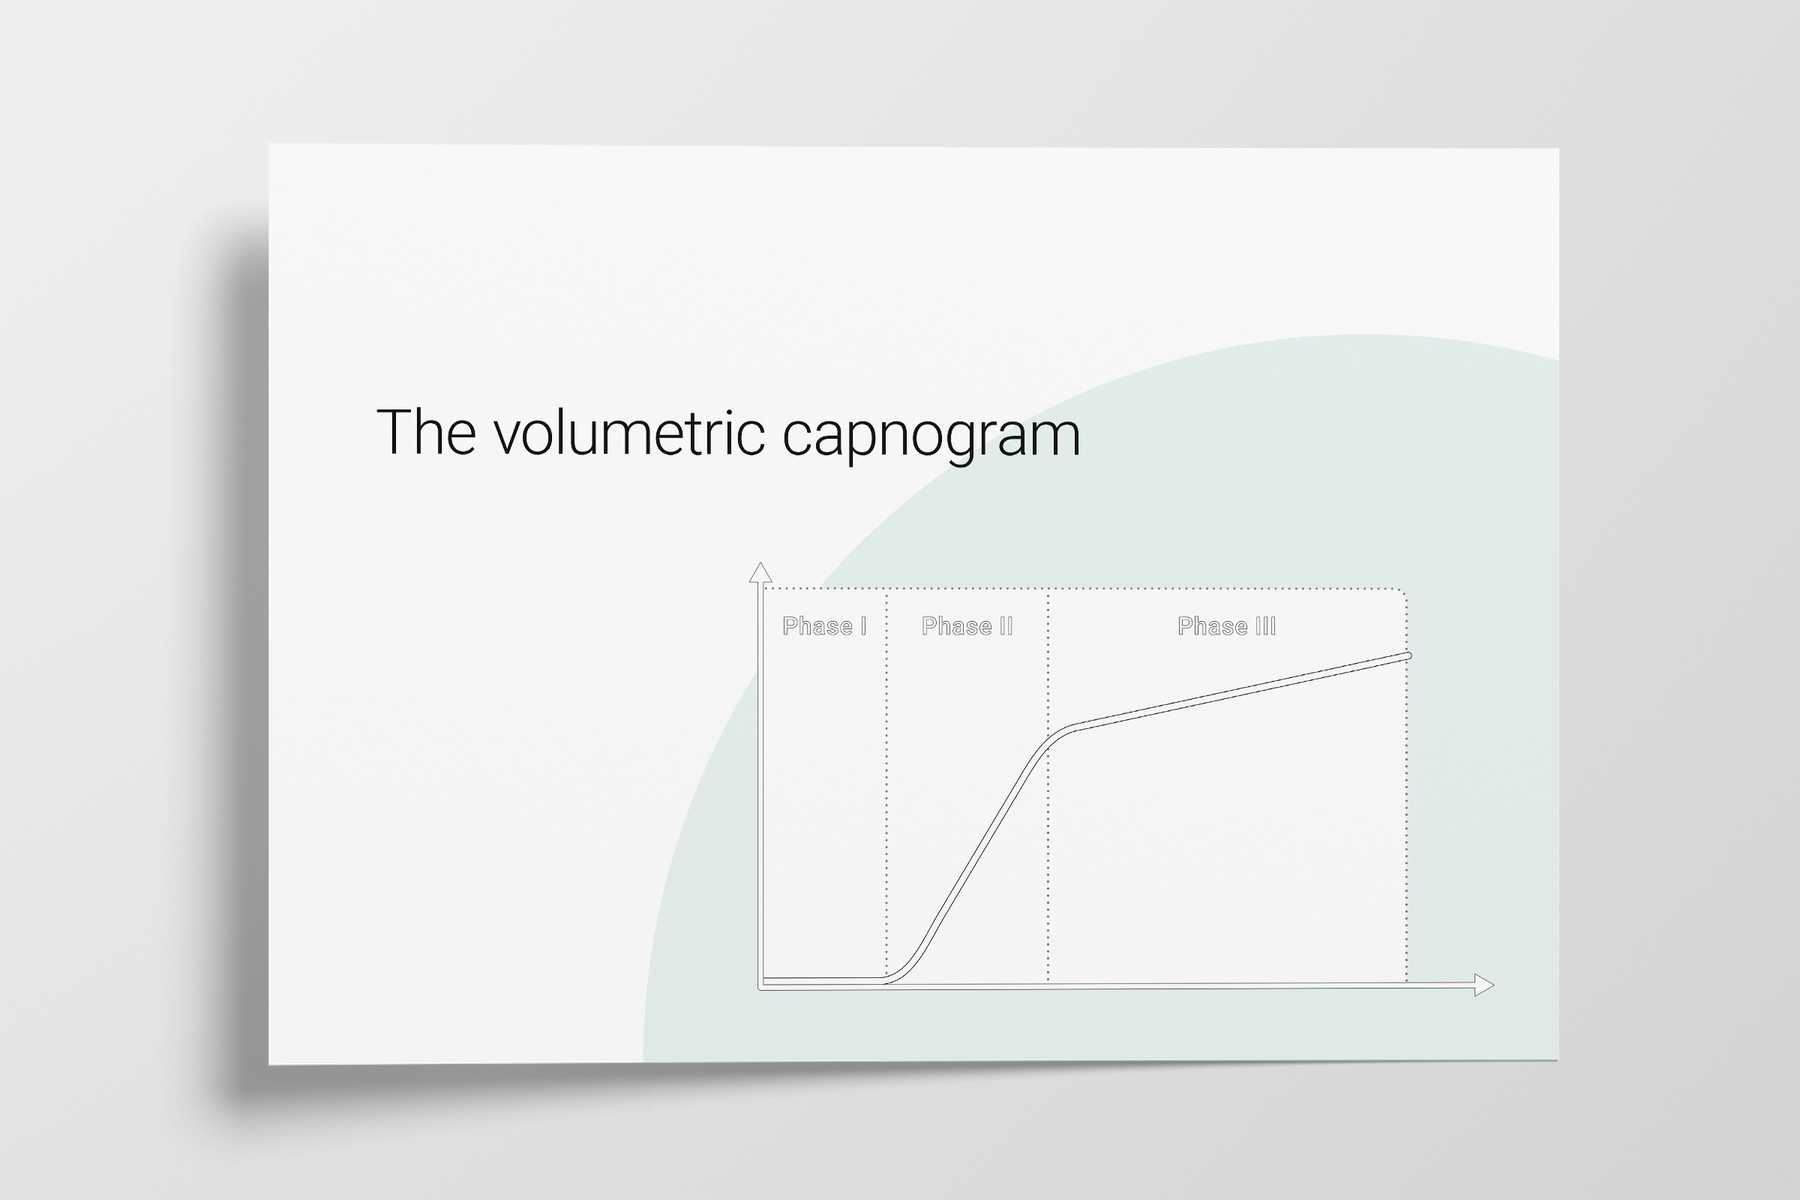
Expired gas receives CO2 from three sequential compartments of the airways, forming three recognizable phases on the expired capnogram. A single‑breath curve in volumetric capnography exhibits these three characteristic phases of changing gas mixtures ‑ they refer to the airway region in which they originate:
- Phase I ‑ Anatomical dead space
- Phase II ‑ Transition phase: gas from proximal lung areas and fast‑emptying lung areas
- Phase III ‑ Plateau phase: gas from alveoli and slow‑emptying areas
Using features from each phase, physiologic measurements can be calculated.
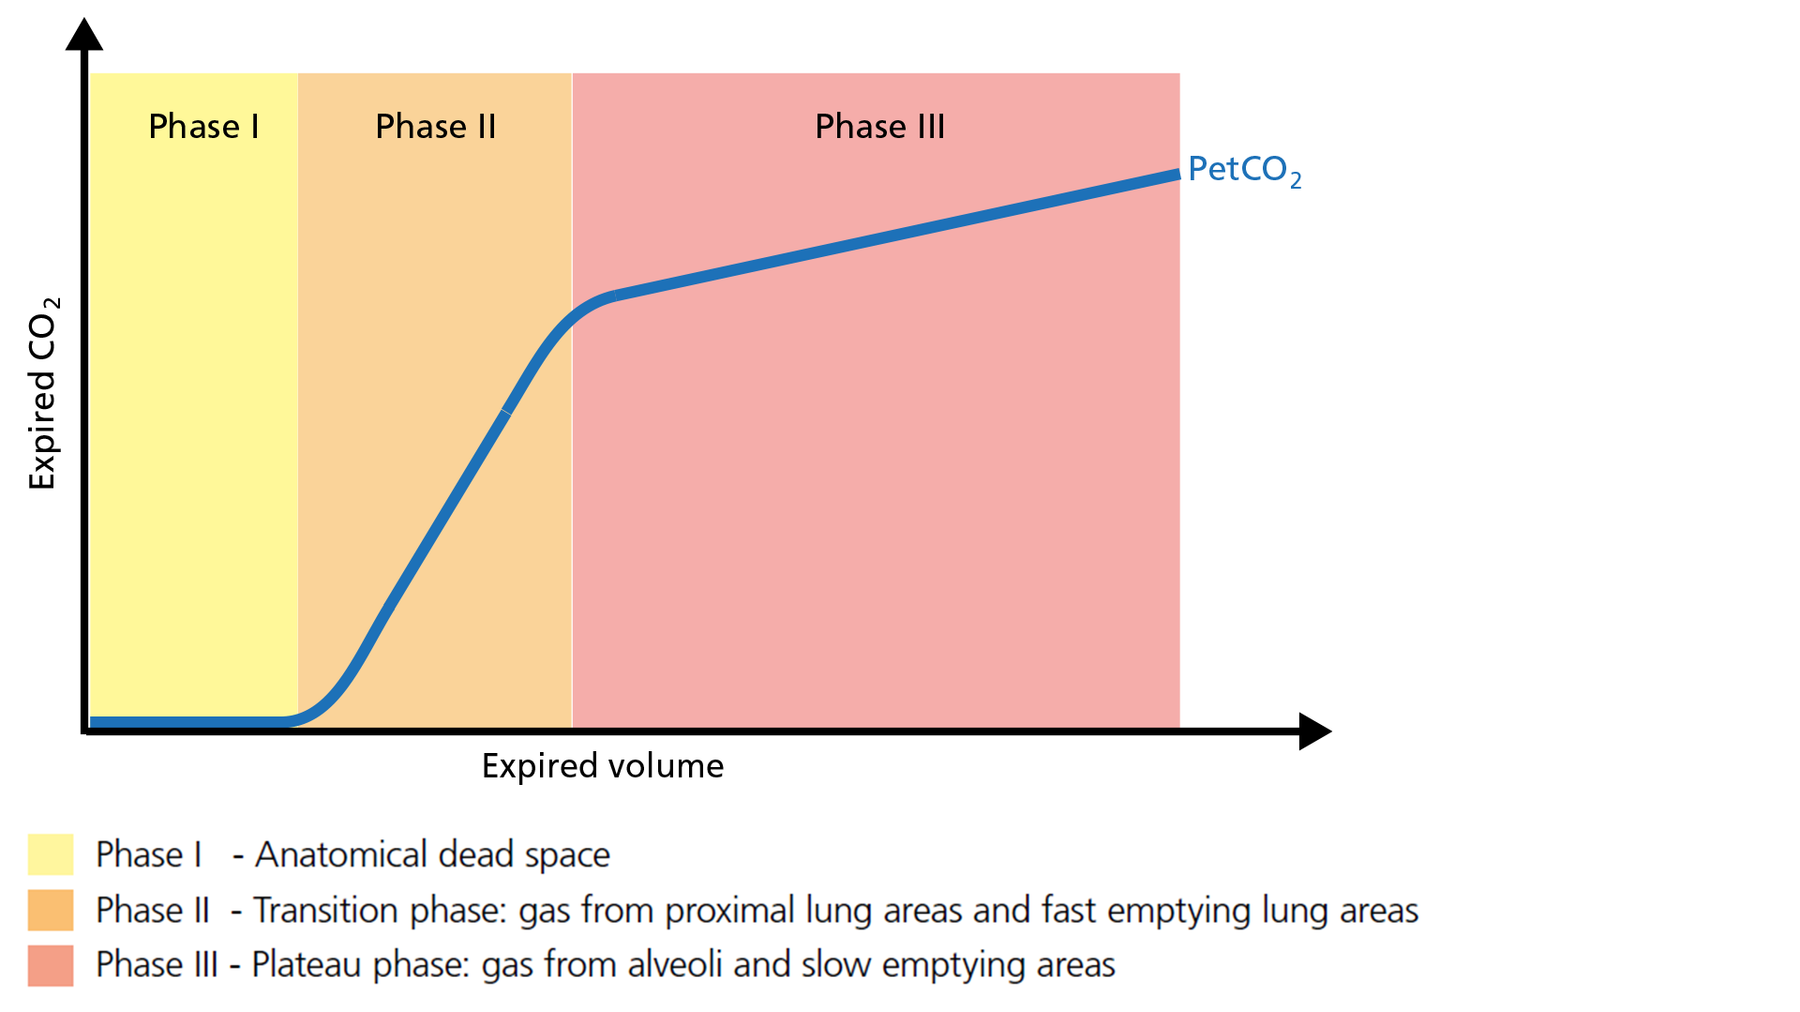
Figure 1: The three phases of the volumetric capnogram
Phase I of the volumetric capnogram: anatomical dead space
The first gas that passes the sensor at the onset of expiration comes from the airways and the breathing circuit where no gas exchange has taken place = anatomical + artificial dead space. This gas usually does not contain any CO2. Hence the graph shows movement along the X‑axis (expired volume), but no gain in CO2 on the Y‑axis (Figure 2).
Good to know: A prolonged Phase I indicates an increase in anatomical dead space ventilation (VDaw). Presence of CO2 during Phase I indicates rebreathing or that the sensor needs to be recalibrated.
Figure 2: Phase I of the volumetric capnogram
Phase II of the volumetric capnogram: transition phase
Phase II represents gas that is composed partially of distal airway volume and mixed with gas from fast‑ emptying alveoli. The curve slope represents transition velocity between distal airway and alveolar gas ‑ providing information about perfusion changes and also about airway resistances (Figure 3).
Good to know: A prolonged Phase II can indicate an increase in airway resistance and/or a Ventilation/Perfusion (V/P) mismatch.
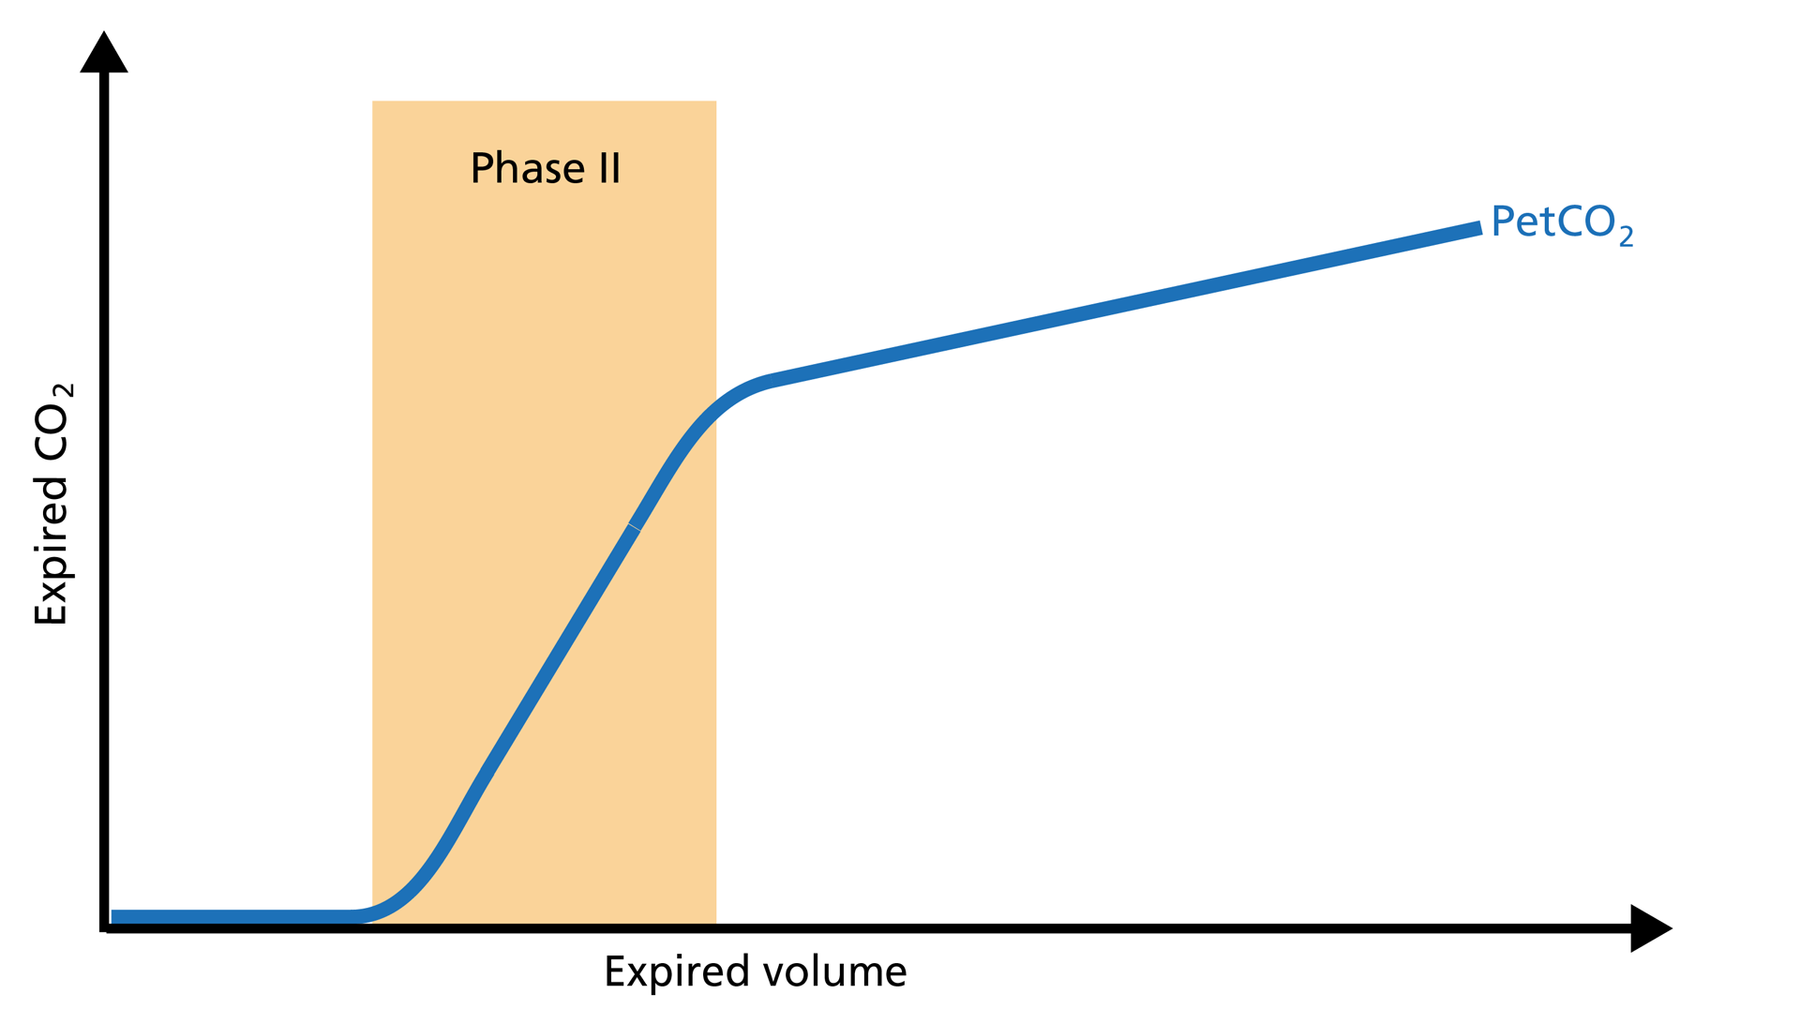
Figure 3: Phase II of the volumetric capnogram
Phase III of the volumetric capnogram: plateau phase
Phase III gas is entirely from the alveoli where the gas exchange takes place. This phase is representative of gas distribution. The final CO2 value in Phase III is called end‑tidal CO2 (PetCO2) (Figure 4).
Good to know: A steep slope in Phase III provides information about lung heterogeneity with some fast‑ and some slow‑emptying lung areas. For example, an obstructed airway results in insufficiently ventilated alveoli, inducing high CO2 values and increased time constants in this region.
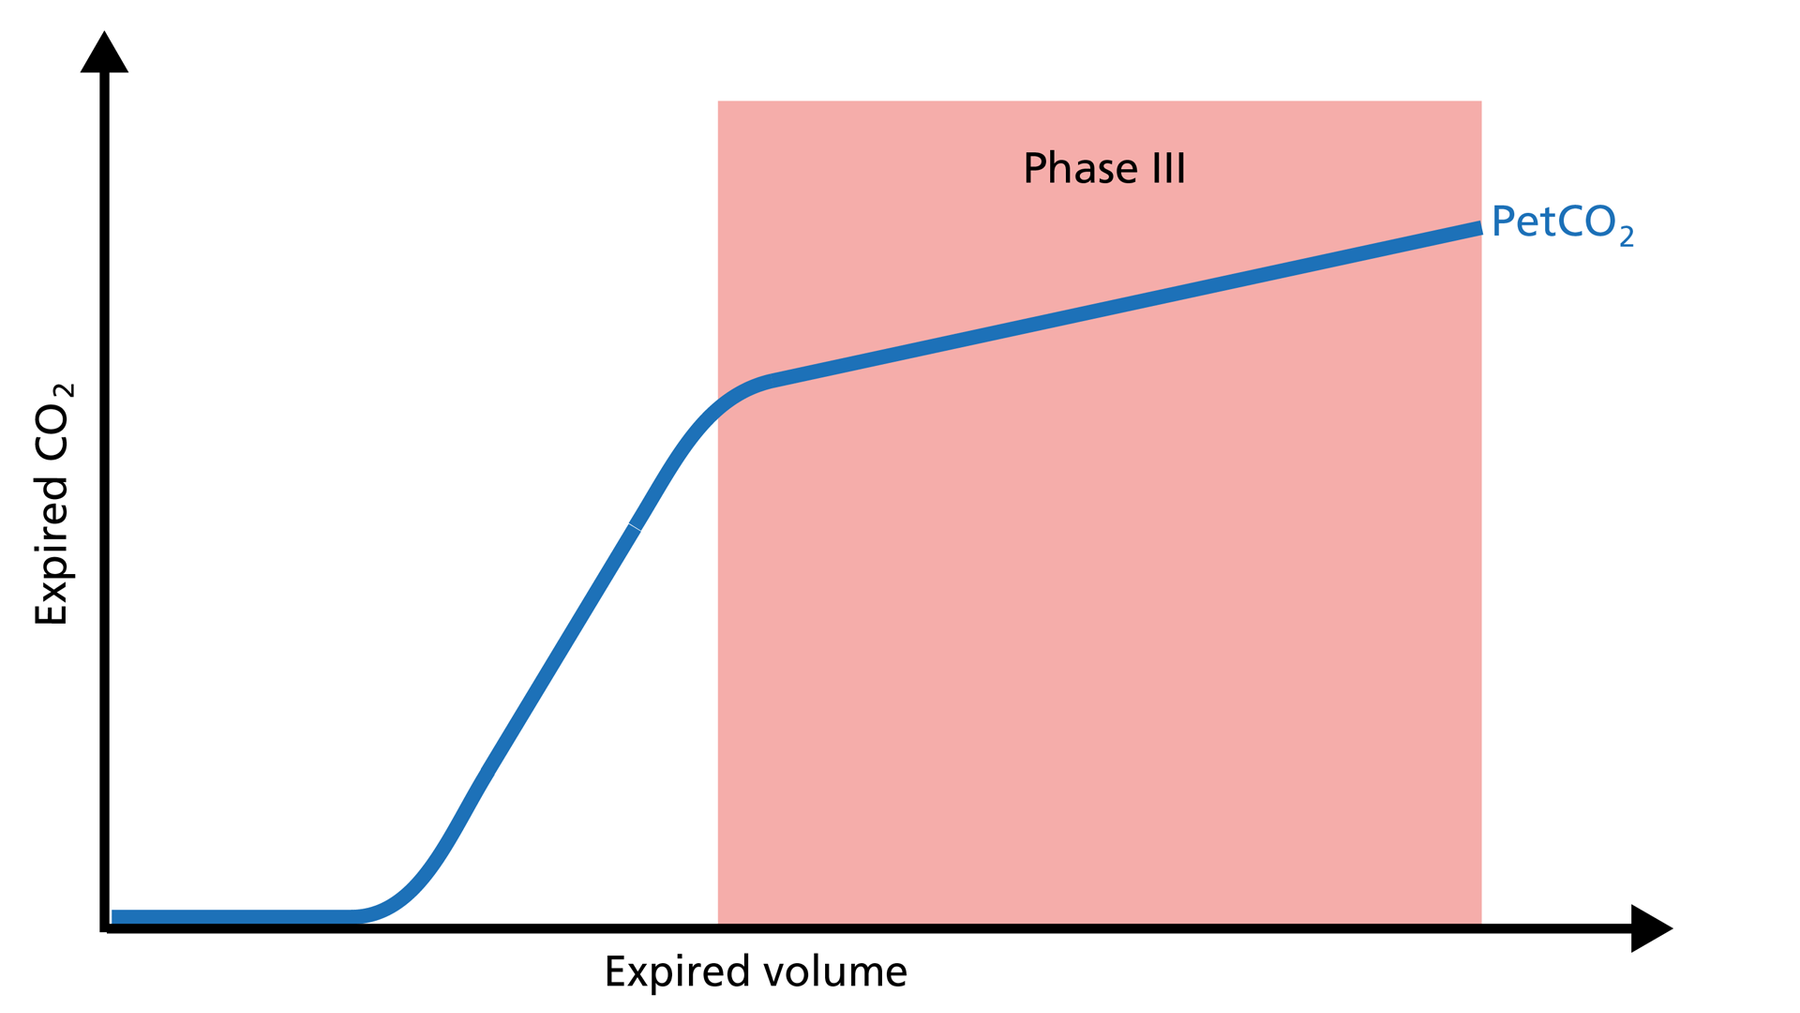
Figure 4: Phase III of the volumetric capnogram
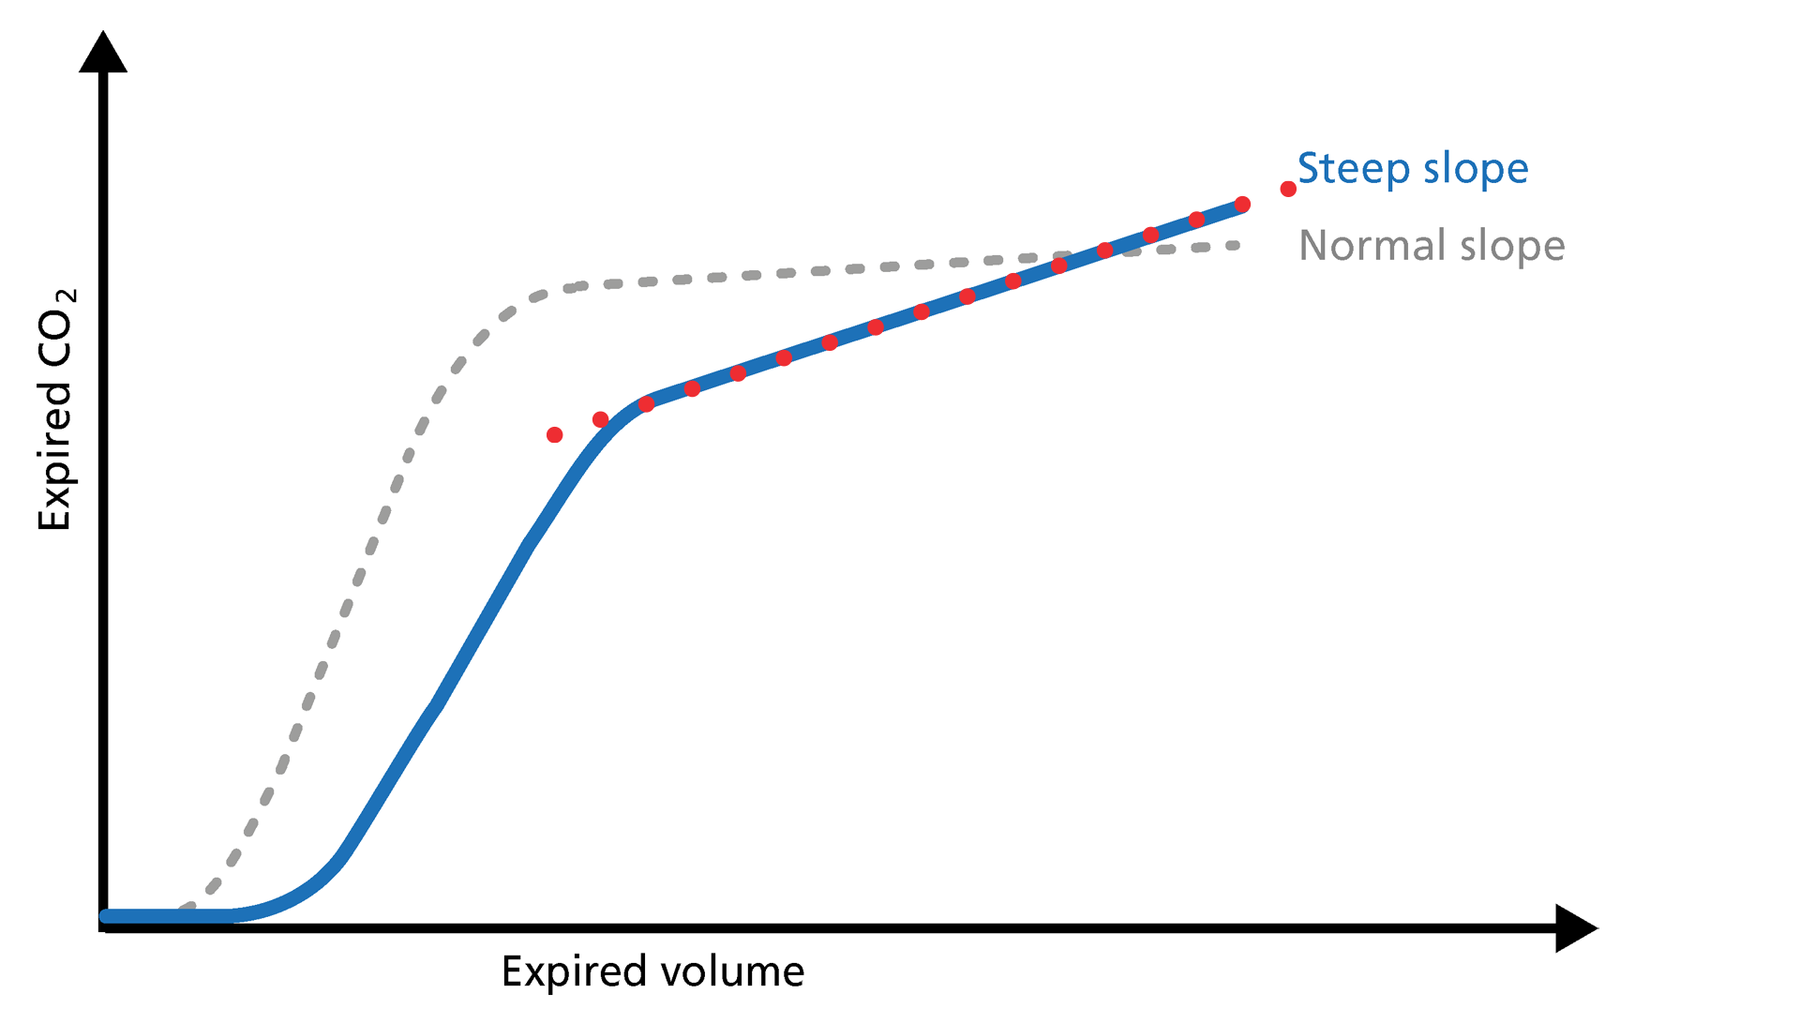
Figure 5: Slope of Phase III
Slope of Phase III
The slope of Phase III is a characteristic of the volumetric capnogram shape. This slope is measured in the geometric center of the curve, which is defined as the middle two quarters lying between VDaw and the end of exhalation (Figure 5).
Good to know: In Phase III, a steep slope can be seen, for example, in COPD and ARDS patients.
Volumetric capnography on Hamilton Medical ventilators
All Hamilton Medical ventilators offer volumetric capnography (All models except HAMILTON‑MR1A). It is available as an option on the HAMILTON‑C6, the HAMILTON‑G5, the HAMILTON‑C3, and the HAMILTON‑C1/T1, and as a standard feature on the HAMILTON‑S1.
Author: Karjaghli Munir, Respiratory Therapist, Hamilton Medical Clinical Application Specialist; Matthias Himmelstoss, ICU Nurse, MSc Physics, Product Manager
Date of first publication: 16.11.2023
Source: Hamilton Medical
References:
- Anderson JT, Owings JT, Goodnight JE. Bedside noninvasive detection of acute pulmonary embolism in critically ill surgical patients. Arch Surg. 1999;134(8):869‑875. doi:10.1001/archsurg.134.8.869
- Aström E, Niklason L, Drefeldt B, Bajc M, Jonson B. Partitioning of dead space‑‑a method and reference values in the awake human. Eur Respir J. 2000;16(4):659‑664. doi:10.1034/j.1399‑3003.2000.16d16.x
- Blanch L, Romero PV, Lucangelo U. Volumetric capnography in the mechanically ventilated patient. Minerva Anestesiol. 2006;72(6):577‑585.
- Eriksson L, Wollmer P, Olsson CG, et al. Diagnosis of pulmonary embolism based upon alveolar dead space analysis. Chest. 1989;96(2):357‑362. doi:10.1378/chest.96.2.357
- Fletcher R, Jonson B, Cumming G, Brew J. The concept of deadspace with special reference to the single breath test for carbon dioxide. Br J Anaesth. 1981;53(1):77‑88. doi:10.1093/bja/53.1.77
- Kallet RH, Daniel BM, Garcia O, Matthay MA. Accuracy of physiologic dead space measurements in patients with acute respiratory distress syndrome using volumetric capnography: comparison with the metabolic monitor method. Respir Care. 2005;50(4):462‑467.
- Kiiski R, Takala J. Hypermetabolism and efficiency of CO2 removal in acute respiratory failure. Chest. 1994;105(4):1198‑1203. doi:10.1378/chest.105.4.1198
- Kumar AY, Bhavani‑Shankar K, Moseley HS, Delph Y. Inspiratory valve malfunction in a circle system: pitfalls in capnography. Can J Anaesth. 1992;39(9):997‑999. doi:10.1007/BF03008353
- Nuckton TJ, Alonso JA, Kallet RH, et al. Pulmonary dead‑space fraction as a risk factor for death in the acute respiratory distress syndrome. N Engl J Med. 2002;346(17):1281‑1286. doi:10.1056/NEJMoa012835
- Olsson K, Jonson B, Olsson CG, Wollmer P. Diagnosis of pulmonary embolism by measurement of alveolar dead space. J Intern Med. 1998;244(3):199‑207. doi:10.1046/j.1365‑2796.1998.00356.x
- Pyles ST, Berman LS, Modell JH. Expiratory valve dysfunction in a semiclosed circle anesthesia circuit‑‑verification by analysis of carbon dioxide waveform. Anesth Analg. 1984;63(5):536‑537.
- RADFORD EP Jr. Ventilation standards for use in artificial respiration. J Appl Physiol. 1955;7(4):451‑460. doi:10.1152/jappl.1955.7.4.451
- Rodger MA, Jones G, Rasuli P, et al. Steady‑state end‑tidal alveolar dead space fraction and D‑dimer: bedside tests to exclude pulmonary embolism. Chest. 2001;120(1):115‑119. doi:10.1378/chest.120.1.115
- Yaron M, Padyk P, Hutsinpiller M, Cairns CB. Utility of the expiratory capnogram in the assessment of bronchospasm. Ann Emerg Med. 1996;28(4):403‑407. doi:10.1016/s0196‑0644(96)70005‑7
- Wolff G, Brunner JX, Grädel E. Gas exchange during mechanical ventilation and spontaneous breathing. Intermittent mandatory ventilation after open heart surgery. Chest. 1986;90(1):11‑17. doi:10.1378/chest.90.1.11
- Wolff G, X. B. J. , Weibel W., Bowes C.L. , Muchenberger R., Bertschmann W. (1989). Anatomical and series dead space volume: concept and measurement in clinical practice. Applied cardiopulmonary pathophysiology, 2, 299‑307.