


Genius AI® Detection Version 2.0 Technology for Breast Tomosynthesis
Summary
The purpose of this paper is to assist users of Genius AI Detection version 2.0 technology to understand the software’s Case Score output. The Case Score output from Genius AI Detection 2.0 software is analyzed on a known database to help users interpret the numerical value of the Case Score by illustrating its distribution on biopsy-proven cancer and non-cancer cases.
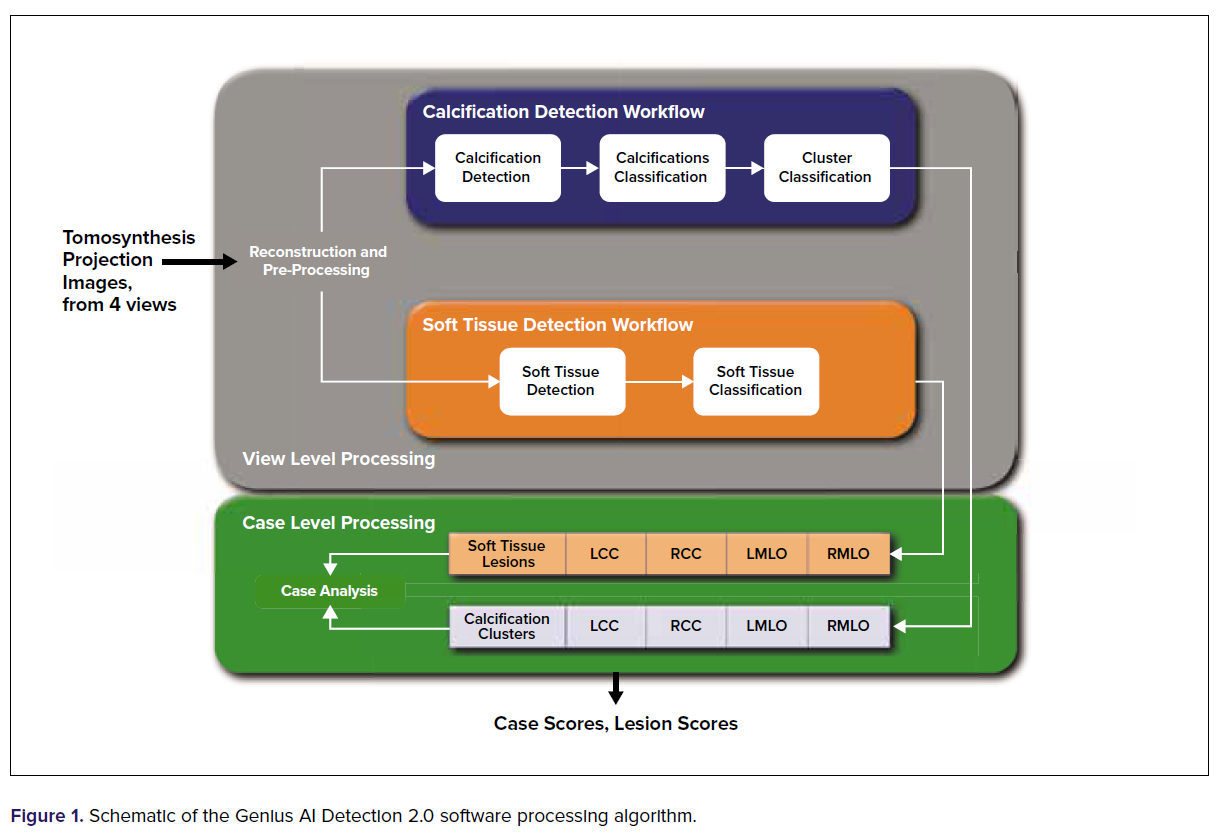
Introduction Genius AI Detection technology is Hologic’s brand name for 3D™ AI CAD, cleared by the U.S. FDA. The software resides on the acquisition workstation of a Dimensions® mammography system and analyzes standard and Hologic Clarity HD® high-resolution tomosynthesis images. Results can be displayed as overlays on tomosynthesis slices including 3DQuorum® SmartSlices and synthesized 2D images. Genius AI Detection technology assists radiologists to interpret mammograms by using a deep-learning neural network to analyze tomosynthesis images and identify lesions which appear to be potentially cancerous. The algorithm searches for the common visual appearances of cancers: calcifications, masses, densities and distortions. Details of the algorithm and performance have been previously covered and a schematic of the AI algorithm is shown in Figure 1.2
There are several outputs from the algorithm:
- Location and outlines of suspicious lesions on the mammograms in the study.
- A Lesion Score, or ranking, of each marked lesion.
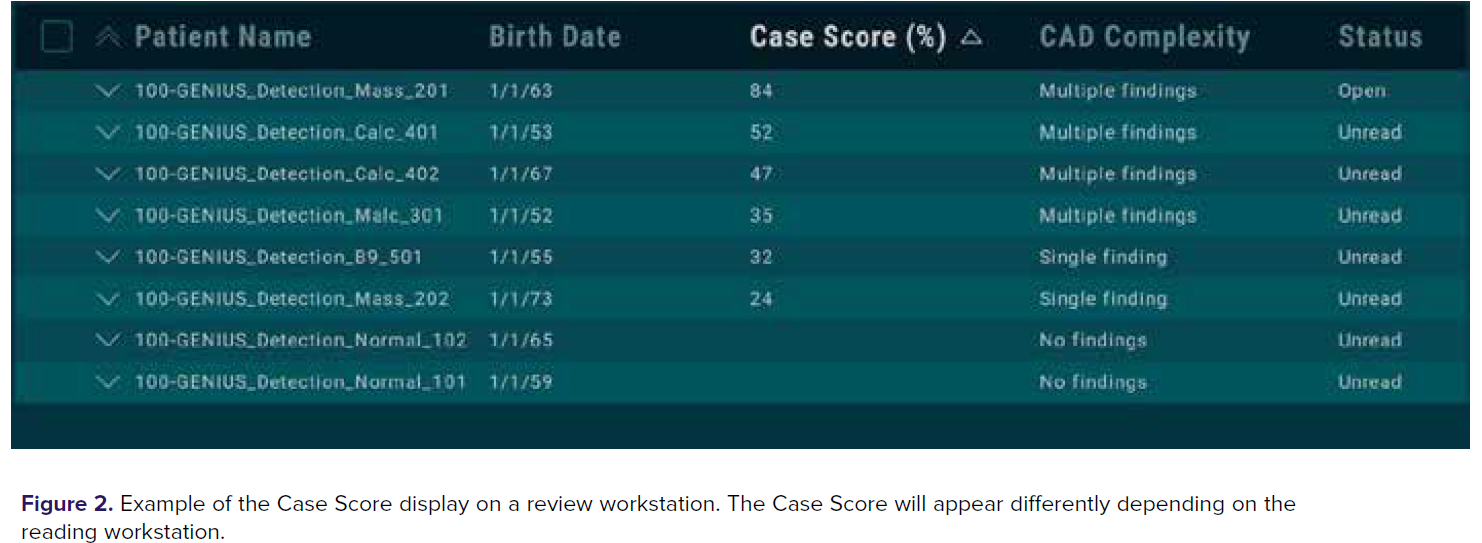
- A Case Score, or ranking, of the entire study. See Figure 2.
Lesion Score
The location and outlines of suspicious lesions are evaluated on standard screening views (CC, MLO), equivalent views (e.g. ML, XCCM), and view modifiers including implant-displaced views.
Each Lesion Score has a value from 1 to 100 and represents the degree of suspicion that may warrant further review. The value is based on the proprietary AI algorithm's initial calculation of how suspicious the lesion looks compared to a known set of lesions from a biopsyproven cancer database. A score close to 100 means that the algorithm found this particular lesion to be more suspicious than most of the database’s known cancerous lesions. Similarly, a Lesion Score close to 0 means the lesion looks less suspicious than the known cancerous lesions in the database; however, it does not mean that the lesion is necessarily benign.
The purpose of the Lesion Score is to give additional information on lesions identified by the AI algorithm. It does not indicate if a lesion is definitively cancerous, which can only be proven by outcome of a biopsy per standard of care.
Case Score
The Case Score has a value from 0 to 100. A Case Score of 0 is given for a case where there are no identified suspicious lesions in the study. The Case Score is the maximum of the Lesion Scores of the entire case.
Genius AI Detection technology is an adjunct device and can be used as a concurrent read during mammographic interpretation. It is important to note that neither the Lesion Score nor the Case Score represents a probability of malignancy, even though both scores use 100-point scales. All cases, including ones with a case score of 0, may contain a cancer, so they need to be evaluated. As per indication of use of this device, no case should be dismissed without a review. Rather, the scores help determine the likelihood of the presence of a suspicious lesion that could potentially warrant a further investigation by the interpreting physician.
It is also important to note that false positive marks (marks on suspicious lesions that are not cancer) can sometimes generate high scores, and conversely, marks on suspicious lesions that are cancer can generate low scores. It is possible that no lesion will be marked on a case containing cancer, and this would be a false negative case. The high sensitivity for Genius AI Detection software means that false negative cases are rare, with Genius AI Detection 2.0 software identifying 94% of cancers based on a study conducted for the software’s FDA clearance.1
Interpreting the Case Score
One way to understand a given Case Score is to compare how often a Case Score is assigned to cases containing cancer compared to how often it is assigned to cases without cancer. This comparison can be determined using an independent database not used in training the Genius AI Detection algorithm. The standalone study database used for FDA evaluation is such an independent sequestered database and therefore is used here to illustrate a method to interpret the Case Score.
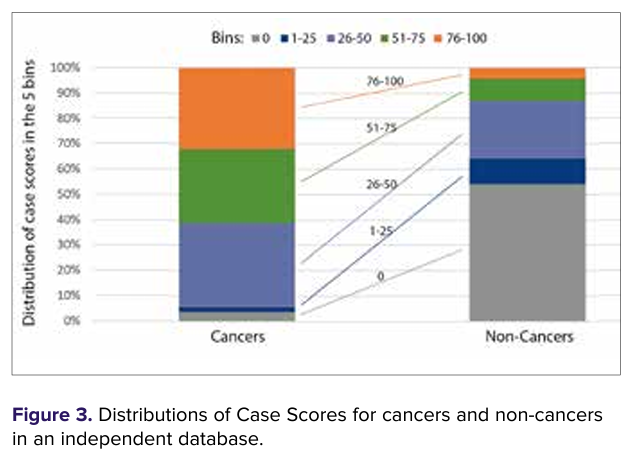
An illustration of the distribution of Case Scores based on this database is shown in Figure 3. The figure shows the distribution in bins of Case Score: 1-25, 26-50, 51-75, and 76-100, and the Case Score of 0, resulting in five categories altogether. As a key to understanding the figure, consider the bar graph on the left which shows the distribution of the cancers from this sequestered database. The top bin, representing Case Scores of 76-100, has a greater fraction of the cancers than the bottom-most bin, representing Case Score of 0. The reverse is true for the bar graph on the right representing non-cancers. The top bin, representing Case Scores of 76-100, has a much smaller fraction of the non-cancer cases than the bin with Case Score of 0. For non-cancers, the most likely Case Score is 0.
These distributions can be used to estimate how often a given Case Score category will occur in a screening environment for both cancers and non-cancers, based on how many cancers and non-cancers are found in the general population. In the U.S., the average breast cancer rate is 5.1 per thousand women.3
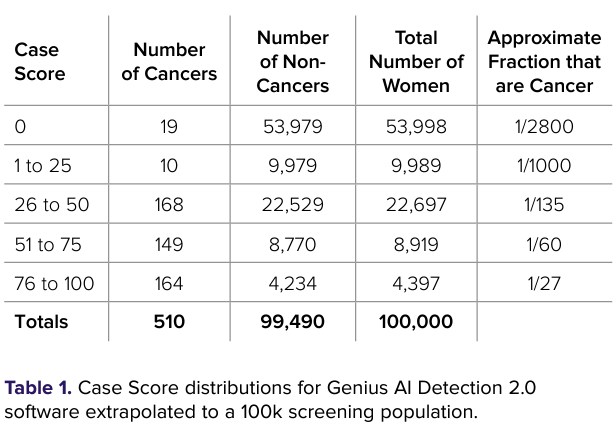
Consider the top bin with a case score of 76-100. This bin contains about 32.1% of cancer cases in the database, and about 4.3% of non-cancer cases had this range. In a population of 100,000 women and the cancer rate of 5.1/1000, there are on average 510 cancers and 99,490 non-cancers. One would expect on average to see about 164 cancers with Case Score of 76-100 (32.1% x 510 cancers), and about 2,700 non-cancers with Case Score of 0 (4.3% x 99,490). Therefore, of the approximately 4,200 cases with a Case Score of 76-100, about 1 in every 27 of these are cancers 164/(4300+164). In this example, the numbers are rounded a bit for clarity; more exact numbers are shown in Table 1. One can do a similar analysis for other Case Score bins, extrapolating from the observed database distributions, to estimate the expected numbers in a general screening environment, and therefore arrive at an estimate of the fraction of a given Case Score that would be a cancer.
The extrapolated results for Genius AI Detection 2.0 software are shown in Table 1, for a population of 100,000 women.
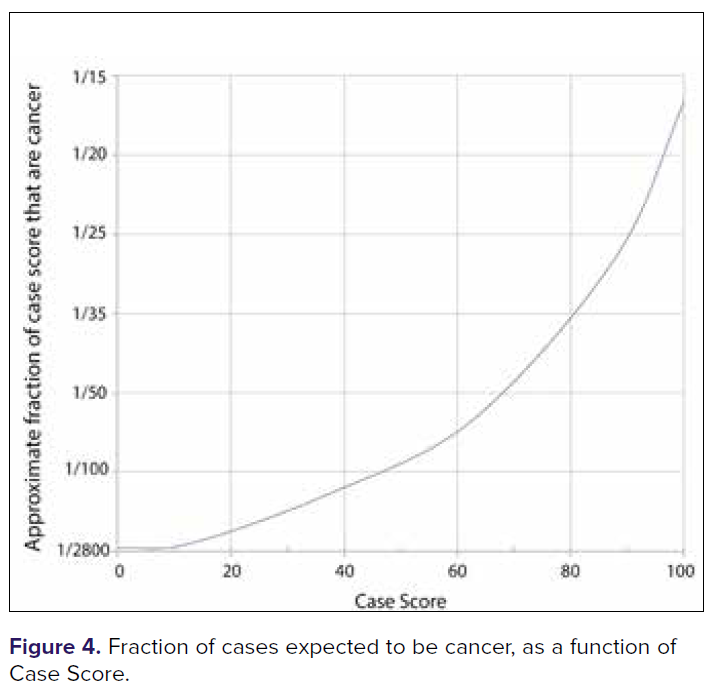
Assuming that the fraction of cases that are likely to be cancer as a function of Case Score is monotonic and smoothly varying, a curve can be generated that shows the cancer fraction for all Case Scores, not just the coarse bins seen in Table 1. The results are shown in Figure 4. Using this graph, for example, for cases with a score of 80, one can see about 1 in 35 of these are expected to be cancerous.
Conclusions
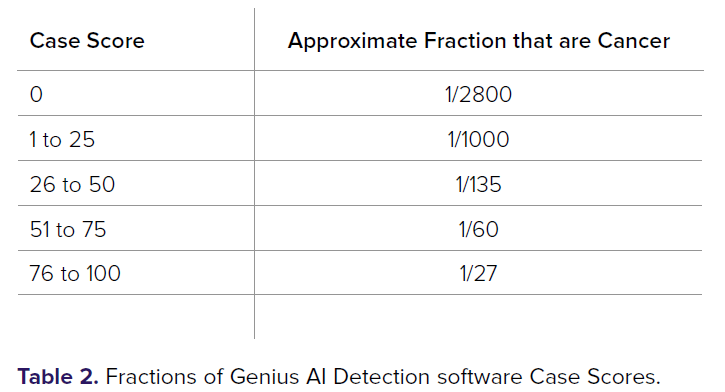
The observed Case Score distributions for cancer and non-cancer cases in a known database allow one to estimate the expected cancer fraction as a function of Case Score, as summarized in Table 2. This table can be referenced when evaluating a patient with a specific Case Score. The likelihood of a patient’s lesion being cancerous increases as the Case Score increases.
Source: Hologic
References
1. Genius AI Detection 2.0, FDA 510k K221449, 10/06/2022
2. Genius AI Detection for Breast Tomosynthesis- Improving radiologist performance and workflow through deep learning AI applications. Kshirsagar A, Keller B, Smith A. WP-00178 Rev. 002 (12/20) Hologic, Inc
3. National Performance Benchmarks for Modern Screening Digital Mammography: Update from the Breast Cancer Surveillance Consortium. Lehman CD, Arao RF, Sprague BL, Lee JM, et al. Radiology. 2017 Apr;283(1):49-58.


