


Introduction
In recent years there has been great interest in measuring the stiffness of tissue in vivo. Indeed, over the past 20 years, different elasticity imaging approaches have been developed around the world [1-4]. Ultrasound elasticity imaging adds mechanical information to conventional diagnostic ultrasound and extends patient diagnostic information. Now more and more doctors have proven its value in many clinical applications, especially in cancer diagnosis [4-8]. Strain elastography has been popular for a long time, providing 2D strain imaging of the ROI (region of interest). Under the same pressure, lower strain corresponds to a harder medium. However, under different pressure, the same tissue may show different strain imaging. Practitioners therefore need more experience to get more reliable images. Shear wave elastography has gained more attention in recent years, providing quantitative stiffness measurement by displaying the shear wave propagation speed or the tissue mechanical modulus, such as shear modulus, and Young's modulus, which is most often used to quantify the stiffness. A high Young's modulus indicates high stiffness. For a linear, elastic, isotropic medium, Young's modulus E can be estimated by E = 3G =3 ρ cs 2 where G is the shear modulus that quantifies how the medium shape changes, ρ is the density, and Cs is the speed of shear wave. So, when a shear wave propagates, a high speed indicates a stiff medium, and a low speed indicates a soft one. [8-10]
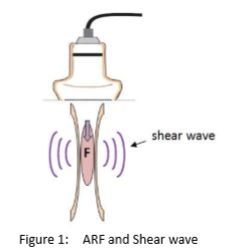
Acoustic Radiation Force and Shear Wave
The Sound Touch Elastography (STE) technology on the Mindray Resona 7 ultrasound system is a new approach developed to display a real-time stiffness image of the ROI. As shown in Figure 1, a strong intensity, safe ultrasound pulse is used to generate shear waves based on the acoustic radiation force (ARF) in soft tissue [3, 9]. The system then tracks the propagation of the shear waves and continuously detects and records the displacement of tissue induced by the shear waves in the ROI. Eventually, the propagation speeds are calculated and the corresponding elastic modulus derived [11]. Multiple shear waves will be generated in different positions in turn to form a full image.
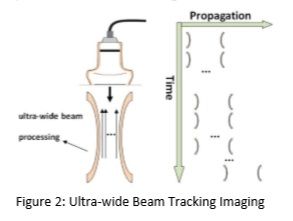
Ultra-wide Beam Tracking Imaging
Conventional systems are limited to just several ultrasound beams on one ultrasound pulse shot, obtaining information from a very shallow area. However, to calculate the shear wave speed, a larger number of signals from as large an area as possible are need to accurately locate the position of the shear wave at every single moment during a very short period of time, typically less than several tenths of a milliseconds. Due to the new Ultra-Wide Beam Tracking Imaging technology, shown in Figure 2, the STE on the Resona 7 provides real-time processing of all the signals from an area as wide as 0.2mm~40mm on one shot. It can therefore effectively detect the entire required shear wave information as high as 10KHz per frame. The amplitude of shear wave induced by ARF is very weak, usually several microns to several tens of microns. So it will slightly adjust the position of the receive beams while the shear wave propagates to focus the energy of ultrasound beam as much as possible to improve the quality of receive signals. Eventually we can capture all the necessary receive data in less than several tenths of a millisecond. Fast signal capture can reduce the influence of noise induced by other movement during the diagnostic procedure such as breathing and heartbeat.
STE Imaging Features
There are two different display modes available. Users can select real time imaging to acquire a continuous image display in most diagnostic procedures. In some cases with tumors which are very hard, large, and deep, it's also possible to select high quality imaging to improve the penetration of shear wave, while only one image is calculated and displayed.
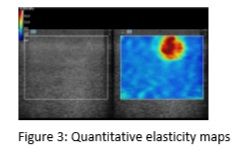
Another major feature of STE is that it provides a choice of different types of quantitative elasticity maps for different clinic applications, as illustrated in Figure 3. Among them, the Cs map indicates shear wave speed with values expressed in m/s, while the G map indicates shear modulus with values expressed in kPa, and the E map indicates Young's modulus.
STE Quantification tools
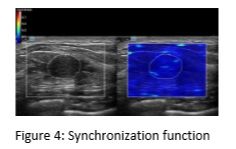
The STE also provides several effective post-measurement tools to help to analyze the elasticity results. They are very easy to learn and very convenient to operate. For example, once a target region is traced on the B-mode image, the synchronization function helps display the relevant trace on the same region of the elasticity image, as illustrated in Figure 4. This is very helpful in identifying the boundary of the lesion.
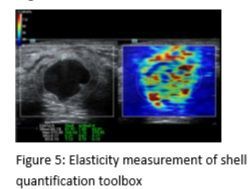
The Shell quantification toolbox is a unique feature developed for Mindray ultrasound systems. As illustrated in Figure 5, the system calculates and displays all the related elasticity values of the shell area of the selected region, allowing selection of the area near to the outside or inside of the target region.
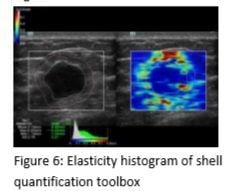
Furthermore, the elastic histogram measurement gives statistics for the color-coded elasticity image. And the results of the target region and its shell can both be displayed for comparison, as illustrated in Figure 6 below.
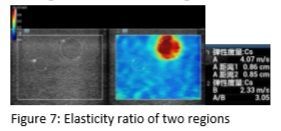
Of course, analysis of values of the different target regions can be selected independently. In addition, the elasticity ratio function can help to calculate the elasticity ratio between two regions, as illustrated in Figure 7.
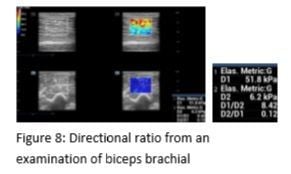
In particularly, the directional ratio is a new feature developed for clinic applications for high anisotropic tissue such as muscle. The shear wave speed may be vastly different in different muscle anatomy sections. In dual-display mode, as illustrated in Figure 8, after the two elasticity images from different anatomy sections are acquired, the directional ratio function allows the quantification of the difference by calculating the ratio of the two shear modulus and provides additional information for diagnosis.
Clinical Study
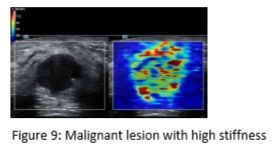
A clinical study was performed on over 100 breast patients using the STE on Mindray Resona 7 in one of the most famous hospitals in Shanghai. The pathology results showed 32 to be malignant and 50 benign. The results of the study show that the STE provides credible and abundant information to help differentiation of benign and malignant lesions in tumor diagnosis. Most malignant cancers produce images with high stiffness. In one of the clinic examples (Figure 9), the STE image of a breast lesion with all red color inside and around indicates the Young's modulus is above 100kPa via the quantitative map. Furthermore, the stiff area on the STE image is larger than the area of lesion on the conventional B-mode image.
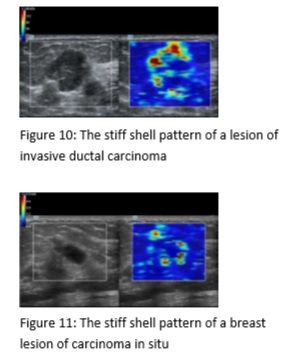
In particular it usually presents a stiff shell pattern in images of most breast malignant lesions. As illustrated in Figure 10, the red shell of a breast invasive ductal carcinoma reveals a much higher stiffness compared to normal tissue. According to the map, the Young modulus of the shell is above 100kPa while the normal tissue is lower than 40kPa. In 22 clinical examinations of malignant lesions, 20 of them showed images with a stiff shell pattern. The shape and the elasticity value of the stiff shell changes with the lesion, as shown in Figure 11, derived from the examination of a breast carcinoma in situ. The maximum Young's modulus of the shell is above 75kPa while normal tissue is lower than 20kPa. With appropriate maps, the stiff shell pattern may become a distinctive, effective pattern to help to identify malignant lesions.
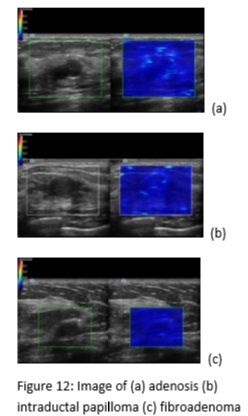
On the contrary, compared with normal tissue, most benign lesions show images with similar stiffness inside, and sometimes slightly higher stiffness around the lesion. The mean Young's modulus inside and around the lesion is often lower than 24kPa. In a few examinations the max value on several points around the lesion is close to 60kPa while the mean value is still low. Figure 12a is an example of breast adenosis, Figure 12b breast intraductal papilloma and Figure 12c breast fibroadenoma.
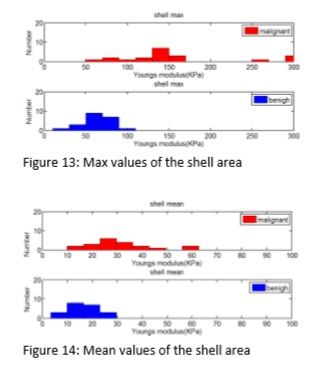
In the clinical study, we recorded the shell max and the shell mean values of 41 patients in which the thickness of shell area were chosen to be 3 millimeters. The results are illustrated in Figure 13 and Figure 14. The results show that the majority of max values and mean values of the shell area of malignant lesions are higher than benign lesions. The average of max values of the shell area from malignant lesions is around 165kPa (distribution from 50kPa to 300kPa), while the average of max values of the shell area from benign lesions is around 64kPa (distribution from 10kPa to 110kPa). The average of mean values of the shell area from malignant lesions is around 31kPa (distribution from 10kPa to 63kPa), while the average of the mean values of the shell area from benign lesions is around 16kPa (distribution from 3kPa to 30kPa).
Conclusion
Mindray's STE technology provides a new method for quantifying the elasticity information of the tissue for clinic ultrasound diagnoses. Along with Resona 7’s ultra-wide beam tracking imaging platform, it detects all the necessary information in several tenths of a millisecond and allows for calculating and displaying of the elasticity image in real time. In the clinical study, the STE technology was applied to the breast patients for the first time and showed highly significant results, although the scale of study was not very large. In particular, the shell analysis tool can provide valuable clinical information for the classification of whether a tumor is malignant or benign.
Further extensive clinical research using STE technology is expected to provide more accurate critical values for the improvement of diagnosis. And changing the thickness of the shell area will be also an interesting approach in the future to determine more meaningful clinical results.
References:
[1] Ophir J, Cespedes I, Ponnekanti H, et al. Elastography: a quantitative method for imaging the elasticity of biological tissues. Ultrasonic Imaging, 1991, 13: 111-134.
[2] L. Gao, KJ Parker. Imaging of the elastic properties of tissue – a review. Ultrasound in Medicine and Biology. 1996, 22(8), 959-976
[3] Sarvazyan AP, Rudenko OV, Swanson SD, Fowlkes JB, EmelianovSY. Shear wave elasticity imaging: A new ultrasonic technology of medical diagnostic. Ultr. Med Biol 1998;20:1419 –1436.
[4] sono-elastography: main clinical applications. Fabarizio calliada, mario canepari, giovanna ferraioli, carlo filice, 2012
[5] Anke Thomas. Real-time sonoelastography performed in addition to B-mode ultrasound and mammography: improved differentiation of breast lesions? Academic Radiology. 2006;13(12):1496-1504
[6] Anke Thomas. ReaL-time sonoelastography of the cervix: tissue elasticity of the normal and abnoramal cervix. Academic Radiology. 2007;14(2):193-200
[7] Jianqiao Zhou, Weiwei Zhan, et al. Stiffness of the surrounding tissue of breast lesions evaluated by ultrasound elastography. European Society of Radiology. 2014; DOI 10.1007/s00330-014-3152-7
[8] JL Gennisson, S Catheline, et al. Transient elastography in anisotropic medium: Application to the measurement of slow and fast shear wave speeds in muscles. J Acoustical Society of America. 2003;114:536-541 [9] M. L Palmeri., M. H Wang. Quantifying hepatic shear modulus in vivo using acoustic radiation force. Ultrasound in Med & Biol. 2008;34(4):546-558
[10] G R Torr. The acoustic radiation force. Am. J. Phys. 1984; 52(5)
[11] Joyce McLaughlin and Daniel Renzi. Shear wave speed recovery in transient elastography and supersonic imaging using propagating front. Inverse Problems. 2006; 22:681–706
Latest Articles
Shear Wave Ultrasound, Mindray, Imaging, Radiation
In recent years there has been great interest in measuring the stiffness of tissue in vivo. Indeed, over the past 20 years, different elasticity imaging approaches have been developed around the world [1-4].


