Improving radiologist performance through Artificial Intelligence and SmartSlices
Brad Keller, Ph.D, Director, Clinical Research Breast Health, Hologic, Inc.
Ashwini Kshirsagar, Ph.D, Chief Scientist, Clinical Solutions, Research and Development, Hologic, Inc. Andrew Smith, Ph.D., Vice President, Image Research Breast Health, Hologic. Inc.
Introduction
The use of breast tomosynthesis in screening has demonstrated an improvement in cancer detection
and a reduction in false positives compared to digital mammography.1 Some of the challenges of the routine use of breast tomosynthesis have been the increase in the number of images that need to be reviewed by radiologists and an increase in the average interpretation time.2 The large file sizes also require adequate PACS storage and high network bandwidth. The recent introduction of high resolution tomosynthesis imaging with 70-micron pixel sizes (Hologic 3Dimensions®) further affects these issues.
In response to these challenges, Hologic has introduced a new type of tomosynthesis images, called 3DQuorumTM, which provides 6-mm thick slices (known as SmartSlices) with 70-micron pixel resolution and utilizes artificial intelligence and machine learning, which along with the Intelligent 2DTM synthesized 2D images, provides the same diagnostic performance as 1-mm thick slices and with a faster average interpretation time as demonstrated in a clinical trial presented to the US FDA.
Design Goals
The most commonly used slice thickness in commercial breast tomosynthesis systems is 1 mm.3 For a common breast thickness of 60 mm, the radiologist needs to review 240 image slices in a standard 4-view screening mammogram set. The design goal of 3DQuorum is to provide fewer, thicker slices for review which speeds up interpretation time, uses smaller files for ease of transfer and storage, and at the same time maintains clinical performance compared to 1-mm breast tomosynthesis datasets.
Some commercial systems provide 10-mm slices, called slabs.4 However, these 10-mm slabs are presented in addition to the thin 1-mm slices, and so they both increase file sizes and are not likely to decrease radiologist interpretation time as they must be reviewed in addition to the 1-mm slices.
It is not readily apparent what the optimal slice thickness should be in breast tomosynthesis. One could make the argument that 1-mm default slices are thinner than needed, given the clinical need of detecting lesions of size 5-10 mm, and the detection of microcalcification clusters where the calcifications are distributed in the z-direction by 10 or more mm. In the case of a 10-mm lesion with distortionsor spiculations pointing out of the plane, it may be better appreciated when the entire lesion can be seen in focus in a given slice, which will only happen with a slice thickness greater than 1 mm.
Using microcalcification clusters as another example, seeing all the calcifications that form a cluster in one slice may aid detection, and can argue for a slice thickness greater than 1 mm. Additionally, searching for microcalcification clusters in hundreds of slices is likely to be slower and more tiring than searching for them in a smaller number of slices.
Design Goals
- Faster radiologist reading time
- Reduced number of tomosynthesis slices
- Reduced data storage space and network traffic
With these observations in mind, Hologic investigated what was an optimal slice thickness greater than 1 mm which could replace the 1-mm slices. While the first design criterion was to ensure maintaining clinical performance, during very initial experiments it was clear that it was necessary to maintain an overlap between adjacent thicker slices for smoother transition during scrolling. This would also ensure that no object was sub-optimally displayed if it happened to lay between two slices. An investigation was conducted to evaluate the performance of a range of slice thicknesses for the SmartSlices, from 4-mm slice thickness with 2-mm overlap, up to 10-mm slice thickness with 5-mm overlap. 2-mm SmartSlices with 1-mm overlap offers no reduction in the total number of slices so that option was rejected in advance. In order to determine optimal slice thickness and overlap size, a series of side-by- side image reviews were conducted where 2 to 3 users with a range of experience in reading tomosynthesis images carefully evaluated lesion appearance of a variety of cancerous and benign lesions. Starting with the configuration of 10 slices with 5-mm overlap, side-by-side evaluation included 8 mm thickness with 4mm overlap, 6 mm thickness with 3 mm overlap and 4 mm thickness with 2 mm overlap. The cases used for this subjective evaluation incorporated several lesions with small size (less than 1 cm) and low conspicuity to understand if any clinical information is lost during the process of creating SmartSlices. The users were also asked to evaluate appearance of normal tissue structure and report any potential additional call back that could be attributed to the process of creating SmartSlices. The users expressed that 10 mm slice thickness with 5 mm overlap and 8 mm slice thickness with 4 mm tend to show marginal loss of conspicuity when compared with 1 mm reconstructed images, especially for very subtle lesions that consisted of amorphous microcalcification clusters or small architectural distortions in dense breasts. The remaining configurations (6 mm and 4 mm) were deemed to show no loss of conspicuity on any of the lesions evaluated, and also did not indicate any concerns of false recalls due to the creating of SmartSlices. Since 6 mm thickness with 3 mm overlap was more advantageous than 4 mm thickness in reducing the number of images, that option was chosen for the final product. In addition to this subjective evaluation a pilot study with MRMC study design was conducted on approximately 100 cases and 5 readers to understand the difference in AUC using the 1 mm slices and the proposed configuration of SmartSlices at 6 mm. In this pilot study the AUC of the two reconstruction modes was comparable, with the 6 mm SmartSlice mode performing marginally better than 1 mm tomosynthesis mode for AUC. This confirmed that the selected configuration did not result in any loss of clinical information while reducing the number of images to one third of the original 1 mm slices.
With 6-mm SmartSlices and the 3-mm overlap, the number of slices is reduced by 2/3 compared to 1-mm slices. The file size is reduced by approximately 60%, due to the smaller number of final slices.
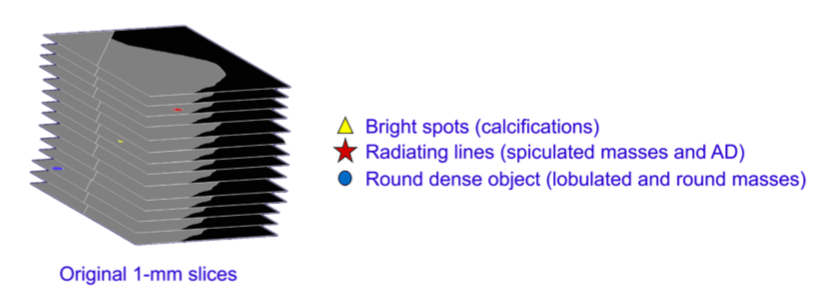
Figure 1. The 1-mm thin slices are searched for features of clinical interest, and their locations are noted
How SmartSlices are Created
Commonly used methods of creating thicker slices, such as simple summing of adjacent thin slices, or Maximum Intensity Projection (MIP) algorithms can create blurring and can also degrade the visibility of low-contrast and smaller objects due to the effect of overlapping tissues. That is why Hologic developed the technology of SmartSlices, designed to ensure the visibility in the 6-mm slices of subtle and important objects seen in the 1-mm slices. The basic philosophy is similar to what is used in our synthesized 2D images Intelligent 2D and relies on artificial intelligence and machine learning.
In the SmartSlice generation process, the input data are 1-mm slices, and a high performance CAD-like algorithm searches each slice for details that may be clinically relevant, such as bright spots that could represent calcifications, radiating lines that could represent spiculations or architectural distortions, and rounded dense objects that might represent lobulated and round lesions. As it finds these objects, it makes a list of their x,y locations and slice numbers. This is shown schematically in Figure 1.
After the search through the 1-mm slices is complete, the 6-mm SmartSlices are created. Information found and marked during the AI search of the 1-mm slices are used in the combining of the 6 slices that are the components of each given SmartSlice. See Figure 2 which illustrates this process.
This step is repeated, ensuring a 3-mm overlap between successive SmartSlices. The following table shows the component slices for each SmartSlice. Because of the overlap, it can be seen that the number of SmartSlices is about 1/3 of the number of 1-mm thick slices. The way the overlap is arranged is shown in Figure 3. In the instances where the original number of slices are not divisible by 3, an extra 1 or 2 slices are reconstructed in order to complete the slabbing process.
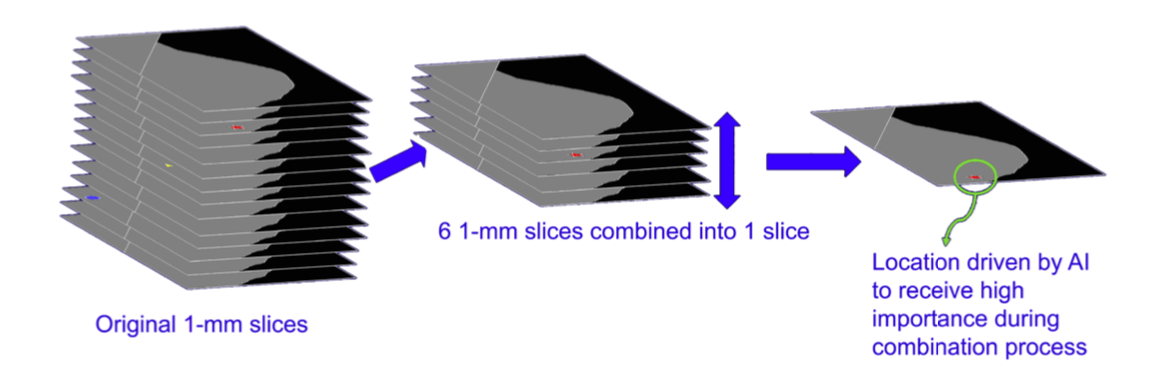
Figure 2. 2 Six 1-mm slices are combined into one 6-mm SmartSlice, giving extra weight to AI-located objects of interest
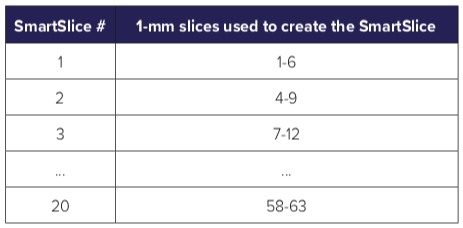
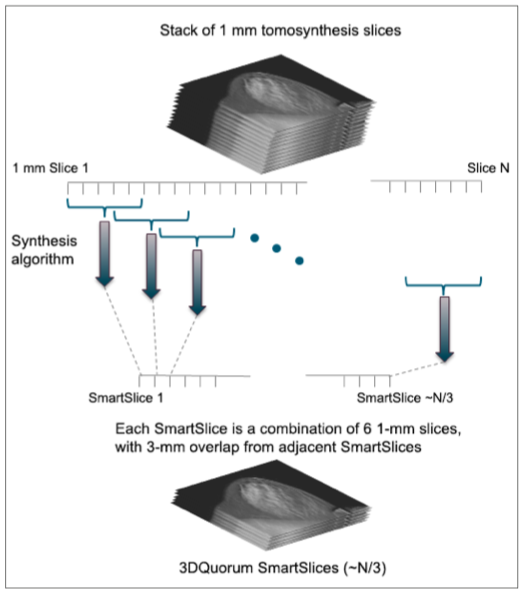
Figure 3. Each SmartSlice is computed from six 1-mm slices, and successive SmartSlices each have an overlap of three 1-mm slices from the previous SmartSlice.
Clinical Study Review
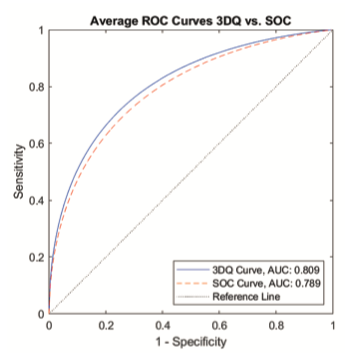
The diagnostic accuracy averaged among all readers reading the 3DQ/I2D (6-mm 3D slices along with high resolution synthesized 2D image) is non-inferior to that of 1 mm 3D slices along with C-View images, as measured by area under the ROC curve.
The recall rate of cancer cases by readers (i.e. sensitivity) using 3DQ/I2D is non-inferior among calcification-only cases to the recall rate using 1 mm 3D slices along with C-View images, on average across all readers.
Conclusions of Clinical Study
The average ROC curves for the performance of 3DQuorum and standard 1-mm tomosynthesis set can be seen in Figure 4. The difference in AUC for the two modalities was +0.027 (p-value = 0.027) in favor of 3DQuorum. Thus the first primary endpoint was reached.
The second primary endpoint was demonstration of a non-inferior recall rate of calcification-only cancer cases by readers (i.e. sensitivity) when reviewing the 3DQ/I2D image set relative to the standard 1-mm tomosynthesis image set with a pre-specified non-inferiority margin of -0.05 of the 95% confidence interval. Mixed regression demonstrated a +0.047 recall rate difference (p-value=0.08) in calcification- only cancers in favor of 3DQuorum, thus the second primary endpoint of non-inferior recall rate for cancers presenting as calcifications only was met.
The average image read time for 3DQ/I2D and for the standard 1-mm tomosynthesis set was calculated. The standard 1-mm tomosynthesis set mean read time was 61.9 seconds and the 3DQ/I2D mean read-time was 54.5 seconds. This corresponds to about a 13% reduction in read time when using 3DQuorum, and translates into an average time savings of 1 hour per 8 hour day.
The clinical study results indicate that we have met our design goals for the use of 3DQuorum plus synthesized 2D imaging, namely a significant reduction in reading time and with approximately 1/3 the number of slices compared to 1-mm tomosynthesis.
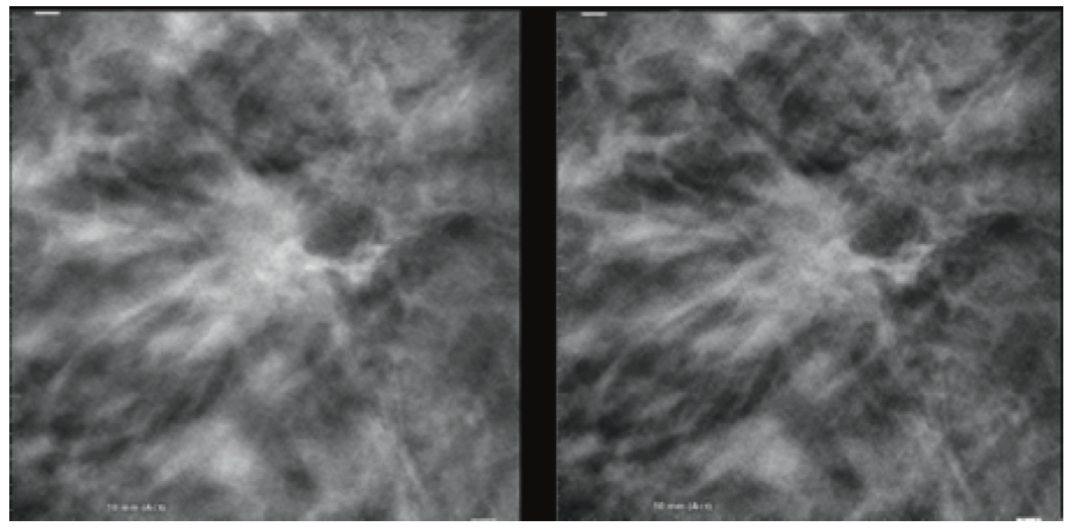
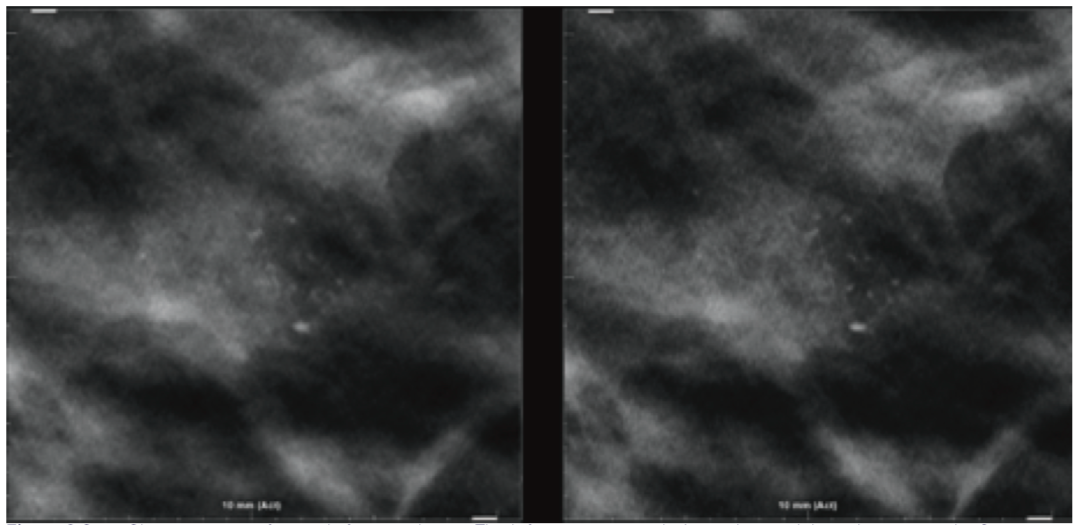
Image Examples
Clinical Implementation
Hologic understands that some customers may want to gain confidence in SmartSlices before using them in their clinical practice to replace their current mode of 1 mm tomosynthesis slices. Therefore, Hologic’s acquisition station (AWS) will allow a configuration where both tomosynthesis slices as well as SmartSlices are created. The AWS also can be configured to send either or both the modes of slices to review workstation and PACS. Thus, customers can continue to generate 1 mm slices in addition to SmartSlices and send both of them to the review workstation until the users gain confidence on SmartSlices. During this period, they can choose to send either of the images to the PACS storage and decide to completely switch to SmartSlices when they are ready.
Conclusion
Hologic has introduced with the product 3DQuorum 6-mm slices known as SmartSlices that significantly reduce the number of slices and file sizes in a tomosynthesis dataset, while maintaining clinical performance compared to 1-mm datasets. The fewer number of total slices in the study allows a decrease in radiologist interpretation time, saving on average 1 hour per reader in an 8-hour day.
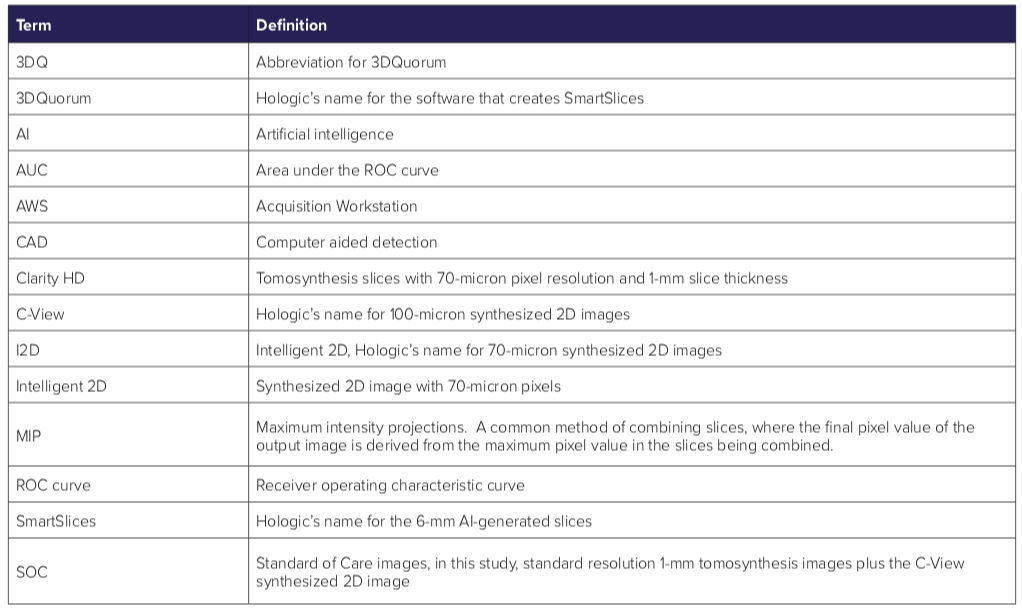
Glossary
References
Friedewald SM, Rafferty EA, Rose SL, et al. Breast cancer screening using tomosynthesis in combination with digital mammography. JAMA, 2014 Jun 25;311(24):2499-507.
Dang PA, Freer PE, Humphrey KL, et al. Addition of Tomosynthesis to Conventional Digital Mammography: Effect on Image Interpretation Time of Screening Examinations. Radiology 2014 Jan; 270(1):49-56.
Vedantham S, Karellas A, Vijayaraghavan GR, et al. Digital Breast Tomosynthesis: State of the Art, Radiology 2015 Dec; 277(3):663–684.
https://assets.publishing.service.gov.uk/government/ uploads/system/uploads/attachment_data/file/771830/ GE_Pristina_Tomo.pdf